. 2016 Nov 9;20(5):654-665.
doi: 10.1016/j.chom.2016.09.015. Epub 2016 Oct 20.

N6-Methyladenosine in Flaviviridae Viral RNA Genomes Regulates Infection

Affiliations

N6-Methyladenosine in Flaviviridae Viral RNA Genomes Regulates Infection

Nandan S Gokhale et al. Cell Host Microbe. .

Abstract

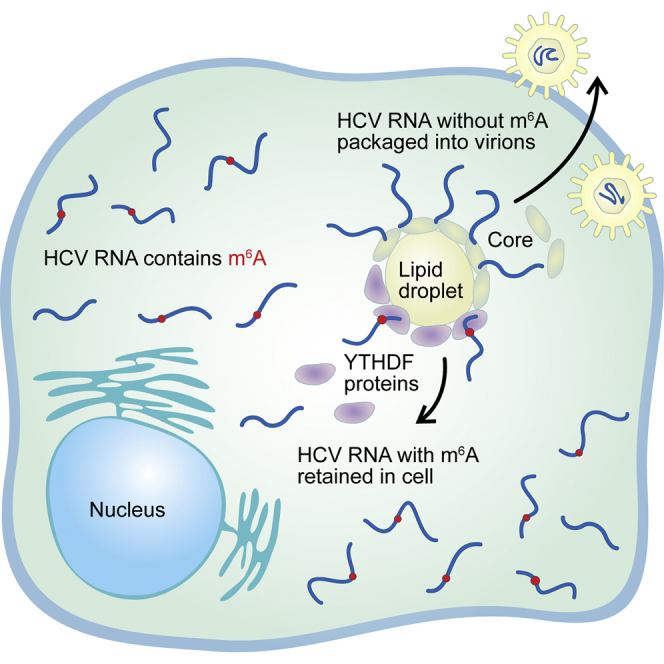
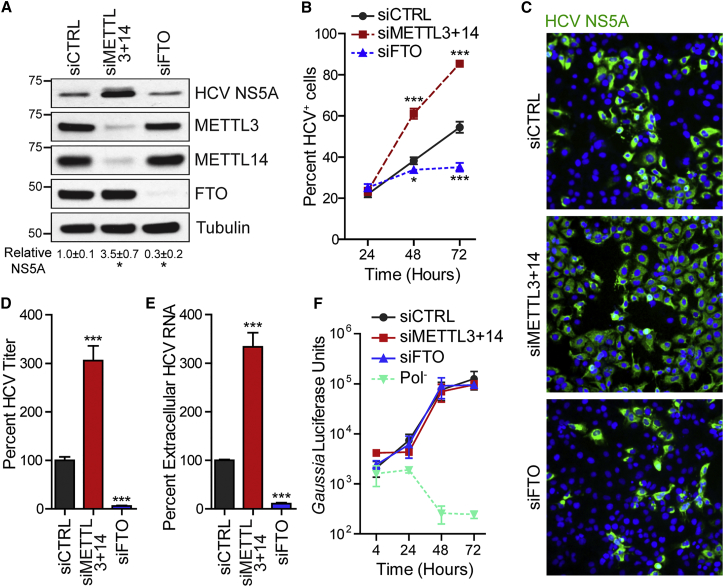
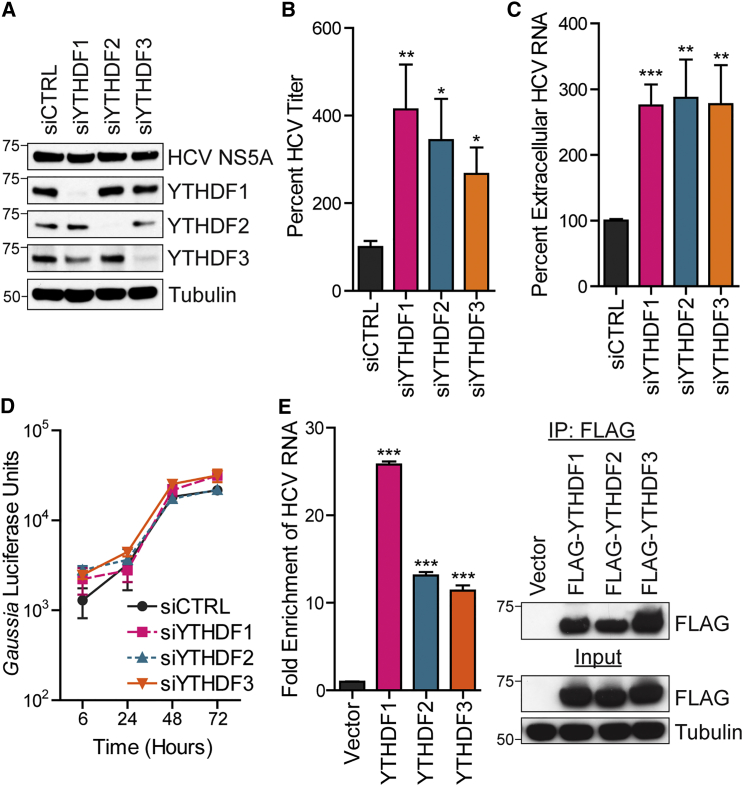
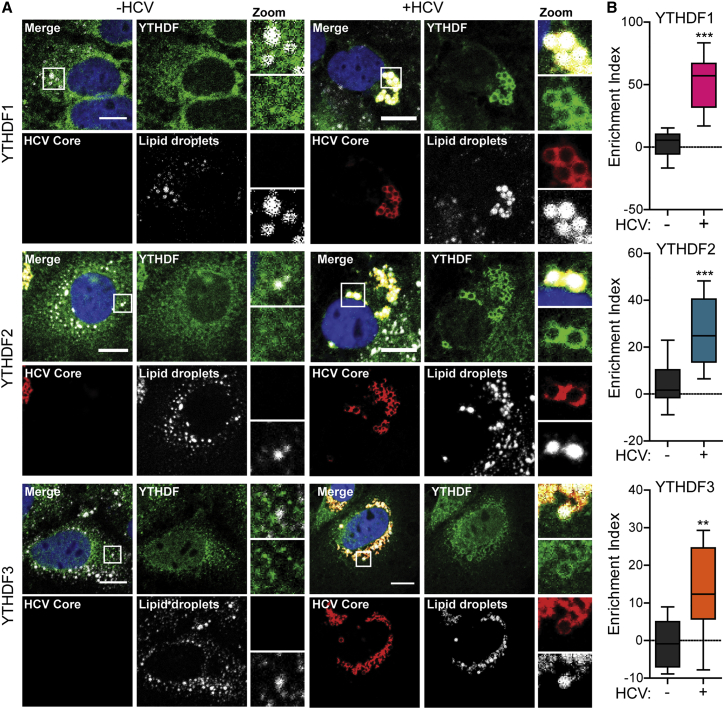
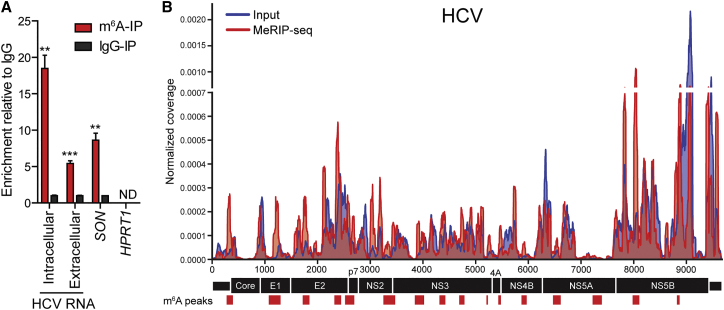
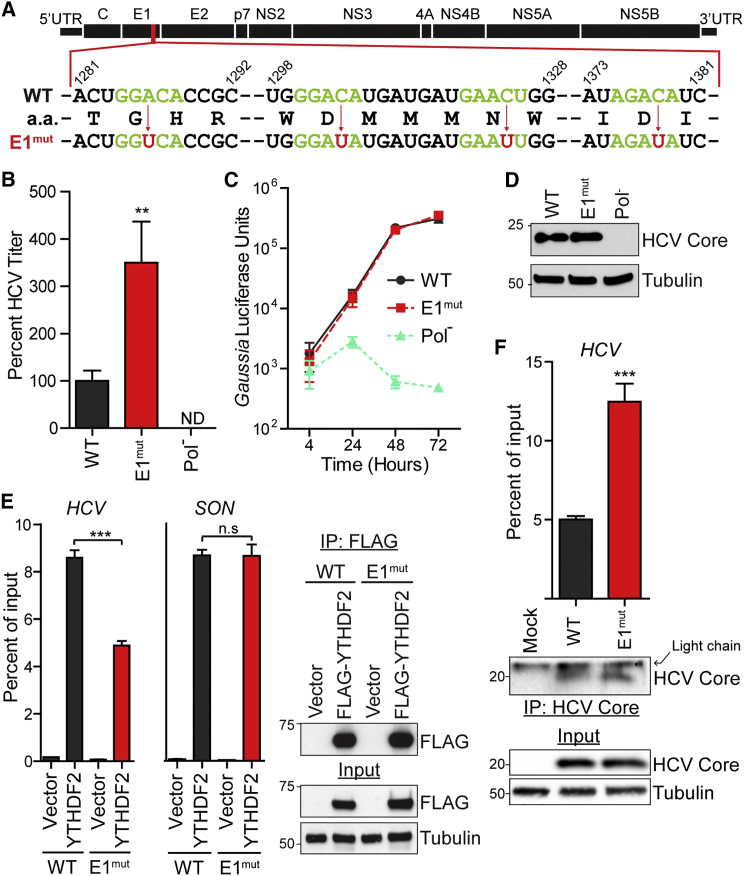
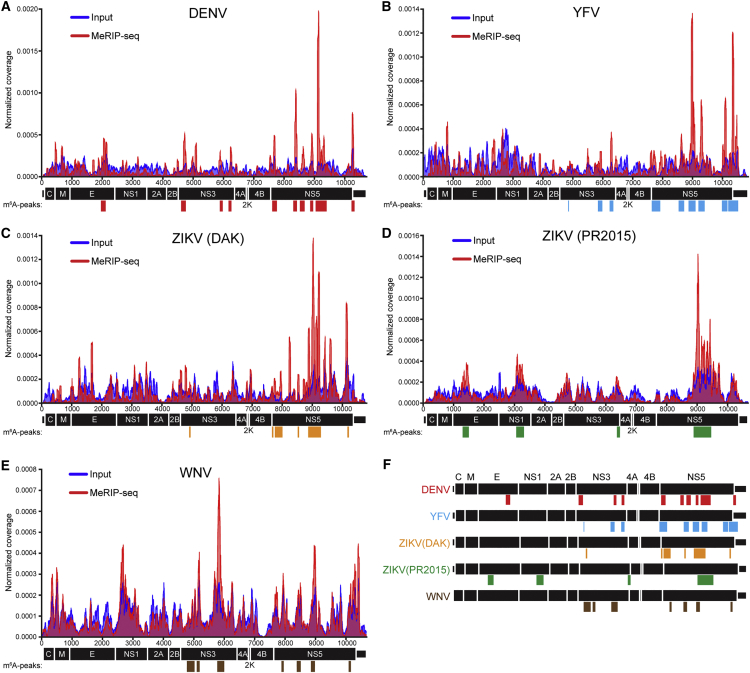
The RNA modification N6-methyladenosine (m6A) post-transcriptionally regulates RNA function. The cellular machinery that controls m6A includes methyltransferases and demethylases that add or remove this modification, as well as m6A-binding YTHDF proteins that promote the translation or degradation of m6A-modified mRNA. We demonstrate that m6A modulates infection by hepatitis C virus (HCV). Depletion of m6A methyltransferases or an m6A demethylase, respectively, increases or decreases infectious HCV particle production. During HCV infection, YTHDF proteins relocalize to lipid droplets, sites of viral assembly, and their depletion increases infectious viral particles. We further mapped m6A sites across the HCV genome and determined that inactivating m6A in one viral genomic region increases viral titer without affecting RNA replication. Additional mapping of m6A on the RNA genomes of other Flaviviridae, including dengue, Zika, yellow fever, and West Nile virus, identifies conserved regions modified by m6A. Altogether, this work identifies m6A as a conserved regulatory mark across Flaviviridae genomes.

Keywords: Flaviviridae; HCV; N6-methyladenosine; RNA-modifications; West Nile; Zika; dengue; m(6)A; viral particle production; yellow fever.


Figures

None
Graphical abstract
Figure 1
Figure 1
The m6A Machinery Regulates Infectious HCV Particle Production (A) Immunoblot analysis of extracts of HCV-infected Huh7 cells (72 hpi) treated with siRNAs. NS5A levels were quantified relative to tubulin (n = 3). p ≤ 0.05 by unpaired Student’s t test. (B) Percentage of HCV+ cells by immunostaining of NS5A and nuclei (DAPI) after siRNA. n = 3, with ≥5,000 cells counted per condition. p ≤ 0.05, ∗∗∗p ≤ 0.001 by two-way ANOVA with Bonferroni correction. (C) Representative fields of HCV-infected cells (NS5A+, green) and nuclei (DAPI, blue) at 72 hpi from (B). (D and E) FFA of supernatants harvested from Huh7 cells 72 hpi after siRNA treatment (D). HCV RNA in supernatants harvested from Huh7 cells 72 hpi after siRNA treatment as quantified by qRT-PCR (E). Data are presented as the percentage of viral titer or RNA relative to control siRNA. ∗∗∗p ≤ 0.001 by unpaired Student’s t test. Values are the mean ± SEM of three experiments in triplicate. (F) Gaussia luciferase assay to measure HCV luciferase reporter (JFH1-QL/GLuc2A) transfected in Huh7.5 CD81 KO cells after siRNA treatment. Pol, lethal mutation in HCV NS5B polymerase. Values in (B) and (F) represent the mean ± SD (n = 3) and are representative of three independent experiments. See also Figure S1.
Figure 2
Figure 2
The m6A-Binding YTHDF Proteins Negatively Regulate Infectious HCV Particle Production (A) Immunoblot analysis of extracts of HCV-infected Huh7 cells (48 hpi) treated with indicated siRNAs. (B and C) FFA of supernatants harvested from Huh7 cells at 72 hpi after siRNA treatment (B). HCV RNA in supernatants harvested from Huh7 cells 72 hpi after siRNA treatment was quantified by qRT-PCR (C). Data were analyzed as the percentage of titer or HCV RNA relative to cells treated with control siRNA. Values represent the mean ± SEM of three (C) or four (B) experiments done in triplicate. (D) Gaussia luciferase assay to measure HCV luciferase reporter (JFH1-QL/GLuc2A) transfected in Huh7.5 CD81 KO cells after siRNA. (E) Enrichment of HCV RNA following immunoprecipitation of FLAG-tagged YTHDF from extracts of Huh7 cells after 48 hpi. Left: captured HCV RNA was quantified by qRT-PCR as the percentage of input and graphed as fold enrichment relative to vector. Right: immunoblot analysis of immunoprecipitated extracts and input. For (D) and (E), data are representative of three experiments and show the mean ± SD (n = 3). p ≤ 0.05, ∗∗p ≤ 0.01, ∗∗∗p ≤ 0.001 by unpaired Student’s t test. See also Figure S2.
Figure 3
Figure 3
YTHDF Proteins Relocalize to Lipid Droplets during HCV Infection (A) Confocal micrographs of HCV-infected or uninfected Huh7 cells (48 hpi) immunostained with antibodies to YTHDF (green) and HCV Core (red) proteins. Lipid droplets (gray) and nuclei (blue) were labeled with BODIPY and DAPI, respectively. Zoom panels are derived from the white box in the merge panels. Scale bar, 10 μm. (B) Enrichment of YTHDF proteins around lipid droplets was quantified using ImageJ from more than ten cells analyzed and graphed in box-and-whisker plots, representing the minimum, first quartile, median, third quartile, and maximum. ∗∗p ≤ 0.01, ∗∗∗p ≤ 0.001 by unpaired Student’s t test. See also Figure S3.
Figure 4
Figure 4
HCV RNA Is Modified by m6A (A) MeRIP-qRT-PCR analysis of intracellular or supernatant RNA harvested from HCV-infected Huh7.5 cells (72 hpi) and immunoprecipitated with anti-m6A or IgG. Eluted RNA is quantified as a percentage of input. Values are the mean ± SD (n = 3). ∗∗p ≤ 0.01, ∗∗∗p ≤ 0.001 by unpaired Student’s t test. (B) Map of m6A-binding sites in the HCV RNA genome by MeRIP-seq (representative of two independent samples) of RNA isolated from HCV-infected Huh7 cells. Read coverage, normalized to the total number of reads mapping to the viral genome for each experiment, is in red for MeRIP-seq and in blue for input RNA-seq. Red bars indicate m6A peaks identified in duplicate experiments by MeRIPPeR analysis (FDR-corrected q value < 0.05). See also Figures S4 and S6 and Tables S1 and S2.
Figure 5
Figure 5
m6A-Abrogating Mutations in E1 Increase Infectious HCV Particle Production (A) Schematic of the HCV genome with the mutation scheme for altering A or C residues (red arrows) to make the E1mut virus. Consensus m6A motifs (green) and inactivating mutations (red) are shown. Dashes represent nucleotides not shown. Genomic indices match the HCV JFH-1 genome (AB047639). (B) FFA of supernatants harvested from Huh7 cells after electroporation of WT or E1mut HCV RNA (48 hr) and analyzed as the percentage of viral titer relative to WT. (C) Gaussia luciferase assay to measure levels of the WT, E1mut, or Pol HCV luciferase reporter (JFH1-QL/GLuc2A) transfected in Huh7.5 CD81 KO cells. (D) Immunoblot analysis of extracts of WT, E1mut, or Pol JFH1-QL/GLuc2A transfected in Huh7.5 CD81 KO cells. (E) Enrichment of WT or E1mut reporter RNA or SON mRNA by immunoprecipitation of FLAG-YTHDF2 or vector from extracts of Huh7 cells. Captured RNA was quantified by qRT-PCR and graphed as the percentage of input. Right: immunoblot analysis of anti-FLAG immunoprecipitated extracts and input. (F) Enrichment of WT or E1mut HCV RNA by immunoprecipitation of HCV Core from extracts of Huh7 cells electroporated with the indicated viral genomes (48 hr). Lower: immunoblot analysis of anti-Core immunoprecipitated extracts and input. Data are representative of two (D and E) or three (B, C, and F) experiments and presented as the mean ± SD (n = 3). p ≤ 0.05, ∗∗p ≤ 0.01, ∗∗∗p ≤ 0.001 by unpaired Student’s t test. See also Figure S5.
Figure 6
Figure 6
Mapping m6A in the RNA Genomes of Flaviviridae (A–E) Read coverage of Flaviviridae genomes of (A) DENV, (B) YFV, (C) ZIKV (DAK), (D) ZIKV (PR2015), and (E) WNV for one replicate of MeRIP-seq (red), and input RNA-seq (blue) from matched samples. Colored bars indicate m6A peaks identified by MeRIPPeR analysis. (n = 2; FDR-corrected q value < 0.05). (F) Alignment of replicate m6A sites in the genomes of DENV (red), YFV (blue), ZIKV (DAK) (orange), ZIKV (PR2015) (green), and WNV (brown). See also Figure S6 and Table S3.

References

    1. Alarcón C.R., Goodarzi H., Lee H., Liu X., Tavazoie S., Tavazoie S.F. HNRNPA2B1 is a mediator of m(6)A-dependent nuclear RNA processing events. Cell. 2015;162:1299–1308. - PMC - PubMed
    1. Aligeti M., Roder A., Horner S.M. Cooperation between the hepatitis C virus p7 and NS5B proteins enhances virion infectivity. J. Virol. 2015;89:11523–11533. - PMC - PubMed
    1. Ariumi Y., Kuroki M., Kushima Y., Osugi K., Hijikata M., Maki M., Ikeda M., Kato N. Hepatitis C virus hijacks P-body and stress granule components around lipid droplets. J. Virol. 2011;85:6882–6892. - PMC - PubMed
    1. Bidet K., Garcia-Blanco M.A. Flaviviral RNAs: weapons and targets in the war between virus and host. Biochem. J. 2014;462:215–230. - PubMed
    1. Bocharov G., Ludewig B., Bertoletti A., Klenerman P., Junt T., Krebs P., Luzyanina T., Fraser C., Anderson R.M. Underwhelming the immune response: effect of slow virus growth on CD8+-T-lymphocyte responses. J. Virol. 2004;78:2247–2254. - PMC - PubMed

MeSH terms