. 2016 Nov 21;26(22):3046-3052.
doi: 10.1016/j.cub.2016.09.009. Epub 2016 Oct 20.

Vision Drives Accurate Approach Behavior during Prey Capture in Laboratory Mice

Affiliations

Vision Drives Accurate Approach Behavior during Prey Capture in Laboratory Mice

Jennifer L Hoy et al. Curr Biol. .

Abstract

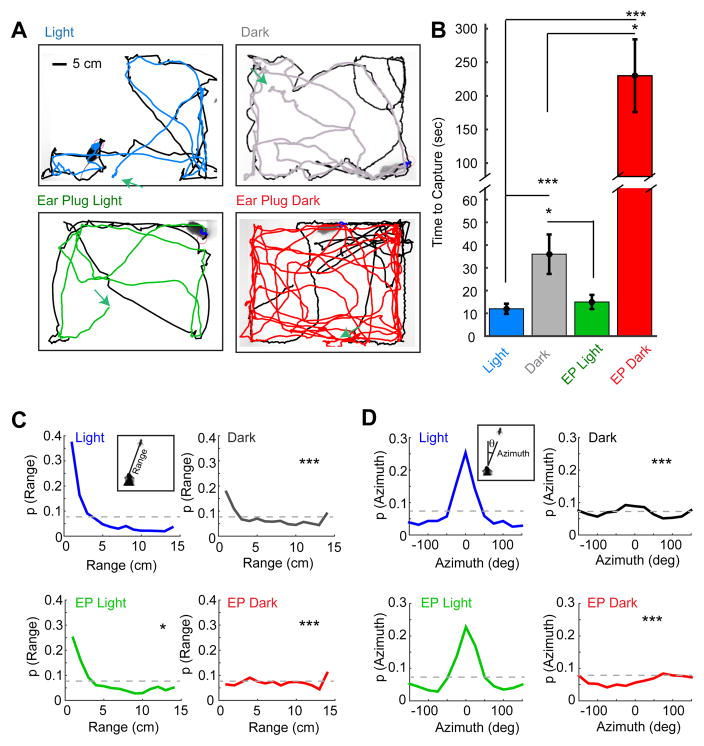
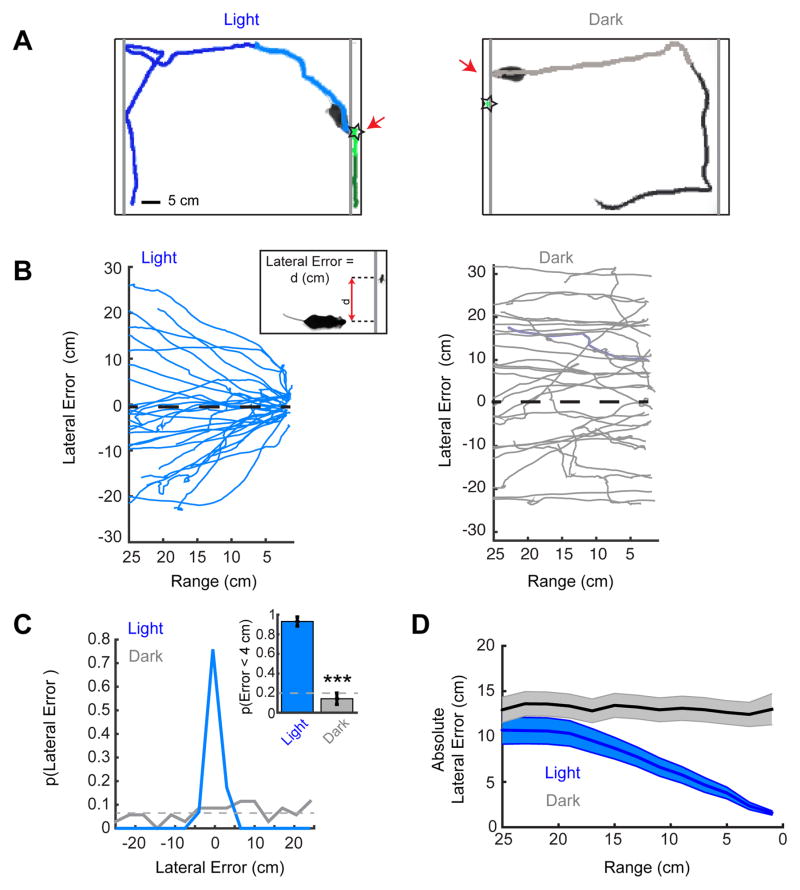
The ability to genetically identify and manipulate neural circuits in the mouse is rapidly advancing our understanding of visual processing in the mammalian brain [1, 2]. However, studies investigating the circuitry that underlies complex ethologically relevant visual behaviors in the mouse have been primarily restricted to fear responses [3-5]. Here, we show that a laboratory strain of mouse (Mus musculus, C57BL/6J) robustly pursues, captures, and consumes live insect prey and that vision is necessary for mice to perform the accurate orienting and approach behaviors leading to capture. Specifically, we differentially perturbed visual or auditory input in mice and determined that visual input is required for accurate approach, allowing maintenance of bearing to within 11° of the target on average during pursuit. While mice were able to capture prey without vision, the accuracy of their approaches and capture rate dramatically declined. To better explore the contribution of vision to this behavior, we developed a simple assay that isolated visual cues and simplified analysis of the visually guided approach. Together, our results demonstrate that laboratory mice are capable of exhibiting dynamic and accurate visually guided approach behaviors and provide a means to estimate the visual features that drive behavior within an ethological context.

Keywords: behavior; ethology; mouse; prey capture; vision.


Figures

Figure 1
Figure 1. C57BL/6J mice reliably perform prey capture in a laboratory setting
(A) Top, prey schematic diagram of the arena for prey capture. Left inset: an example video still of the mouse and cricket. Bottom, timeline of the experimental paradigm. Grey lines indicate the days that are relevant to the above label, arrows indicate that food deprivation began at the end of exposures on Acclimation day 3 (A3) and sensory manipulations were performed after testing trials ended on D4. (B) Top, likelihood of successful capture within 10 min of exposure to cricket in the arena. By D3, mice reach 100% capture success. Bottom, mean capture times averaged over three trials per mouse, per day for successful capture trials on days 1–5 within the arena (D1–D5). Inset, the mean capture times on the final three days are plotted on an expanded time scale due to the 10-fold reduction in capture times from the first day of arena exposure. Data are median ± bootstrapped SEM, n = 47 mice, * =p<0.05, *** =p<0.01, one-way ANOVA with Tukey-Kramer HSD posthoc and χ2 goodness of fit applied to p(Capture success) data. (C) Frames from a movie of a prey capture trial depicting a mouse orienting towards (T= −2.25 sec), approaching (T= −1.25 sec) and intercepting (T=0) a prey target. Times relative to prey interception are shown in the upper right-hand corner of each panel. Blue line shows the path of the mouse and the green line shows the path of the cricket.
Figure 2
Figure 2. Selective sensory perturbation demonstrates that vision is necessary for efficient prey capture performance
(A) Representative paths traveled by the mouse and cricket during a single capture trial performed under each of four sensory conditions. The paths of the mice are colored by condition and prey trajectories are black. Green arrows depict starting locations for the mouse in each trial. Scale bar equals 5 cm. (B) Capture time for four groups of mice differentially tested in each of the four sensory conditions. (C–D) Trial-averaged probability density functions for range (C) and azimuth (D) in the four sensory conditions. Insets depict definitions of range and azimuth. Grey lines indicate chance performance. Time-to-capture group data are median ± bootstrapped SEM, n=16, 10, 8 and 8 mice and n=23, 20, 16, 16 trials for the Light, Dark, EP Light and EP Dark conditions respectively; *=p<0.05, ***=p<001, one-way ANOVA with Tukey-Kramer HSD posthoc. Two-sample, Kolmogorov-Smirnov test for differences between each sensory manipulation and the baseline condition (Light, D5). The difference between Dark and EP Dark was also tested, range: p<0.01, azimuth, p<0.05, 2-sample, Kolmogorov-Smirnov test, n=20 and 16 trials respectively). See also Figure S1, Figure S2, Movie S1, Movie S2, Movie S3 and Movie S4.
Figure 3
Figure 3. Accurate approach behavior during prey capture requires vision
(A) From left to right: range, azimuth and mouse speed over the time preceding the prey contact event shown in Figure 1C. The “approach epoch” is shown as a blue trace overlaid on each exemplary behavioral trace. (B) The median number of approaches per minute, averaged over trials. (C) Probability that an approach leads to prey interception, averaged over trials. (D) Probability that an interception will end in a final capture, averaged over trials. (E) The mean azimuth at a given range during the mouse’s approach under the four different sensory conditions. (F) The mean absolute azimuth at the end of each approach for each sensory condition. Azimuth data are mean ± SEM and all other grouped data are median ± bootstrapped SEM, n=23, 20, 16 and 16 trials and n= 47, 100, 46 and 119 approaches for the Light, Dark, EP Light and EP Dark conditions respectively; *=p<0.05, **=p<0.01, ***=p<0.001, one-way ANOVA with Tukey-Kramer HSD posthoc. See also Figure S1.
Figure 4
Figure 4. An approach paradigm restricted to the visual modality
(A) Representative trials with the prey behind an acrylic barrier for the light (left) and dark (right) conditions. Grey lines indicate clear, acrylic barrier locations. The approach sequences are highlighted as lighter shading of the mouse’s path. Stars indicate the prey’s location when the mouse contacts the barrier. Scale bar equals 5 cm. (B) Lateral error as a function of range from the cricket for all of the mouse’s approaches to the barrier in the Light (left) and Dark (right). Inset, lateral error was defined as the horizontal distance (d) that separated the location of the mouse’s head from the location of the cricket. Positive differences denote that prey was to the left of the mouse and negative values to the right of the mouse. (C) Probability density functions of lateral errors at barrier contact in Light and Dark conditions. Inset, the probability that the mouse will contact the barrier at a location with a lateral error of less than 4 cm (~2 cricket body lengths) from cricket. Grey dashed lines indicate chance performance levels. (D) The mean absolute lateral error as a function of range during approach for Light and Dark conditions. Group absolute error data are mean ± SEM, n=13 and 13 mice and n=29 and 35 trials/approaches for the Light and Dark conditions respectively; ***=p<0.001, Mann-Whitney U. See also Movie S5 and Movie S6.

Comment in

References

    1. Carandini M, Churchland AK. Probing perceptual decisions in rodents. Nat Neurosci. 2013;16:824–31. - PMC - PubMed
    1. Huberman AD, Niell CM. What can mice tell us about how vision works? Trends Neurosci. 2011;34:464–473. - PMC - PubMed
    1. Yilmaz M, Meister M. Rapid innate defensive responses of mice to looming visual stimuli. Curr Biol. 2013;23:2011–2015. - PMC - PubMed
    1. Liang F, Xiong XR, Zingg B, Ji X ying, Zhang LI, Tao HW. Sensory Cortical Control of a Visually Induced Arrest Behavior via Corticotectal Projections. Neuron. 2015;86:755–767. - PMC - PubMed
    1. Zhao X, Liu M, Cang J. Visual cortex modulates the magnitude but not the selectivity of looming-evoked responses in the superior colliculus of awake mice. Neuron. 2014;84:202–213. - PMC - PubMed

Publication types

LinkOut - more resources