. 2016 Nov 23;92(4):780-795.
doi: 10.1016/j.neuron.2016.09.050. Epub 2016 Oct 20.

Protein-RNA Networks Regulated by Normal and ALS-Associated Mutant HNRNPA2B1 in the Nervous System

Affiliations

Protein-RNA Networks Regulated by Normal and ALS-Associated Mutant HNRNPA2B1 in the Nervous System

Fernando J Martinez et al. Neuron. .

Abstract

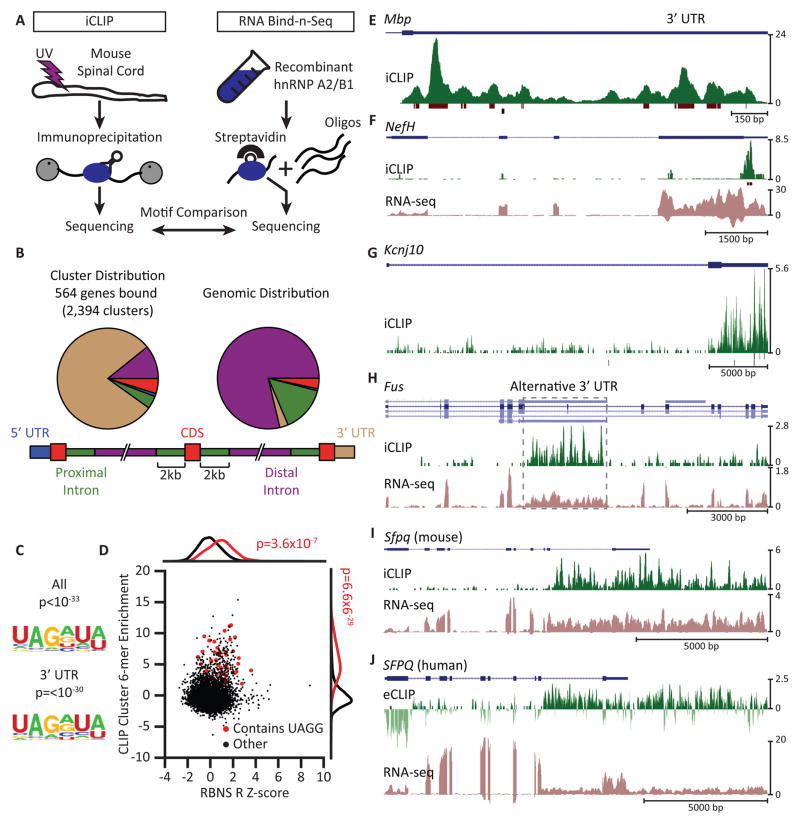
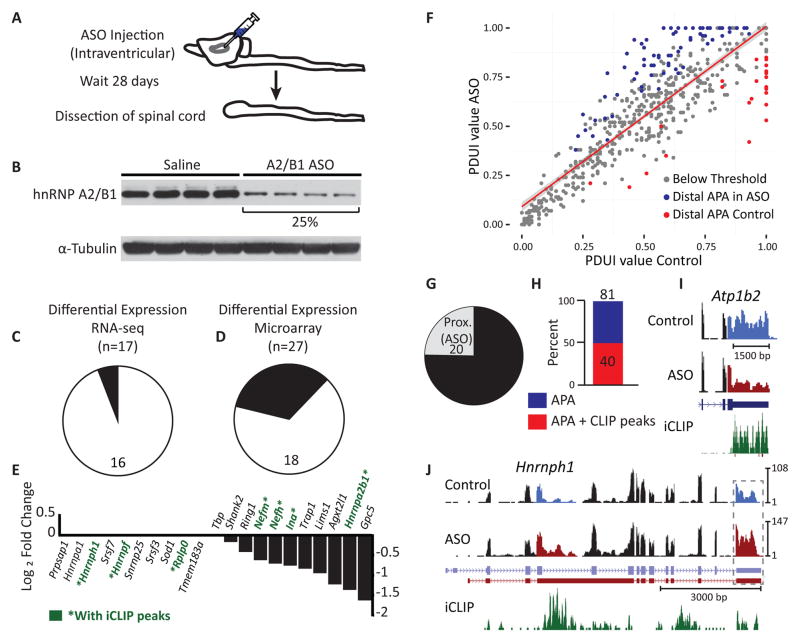
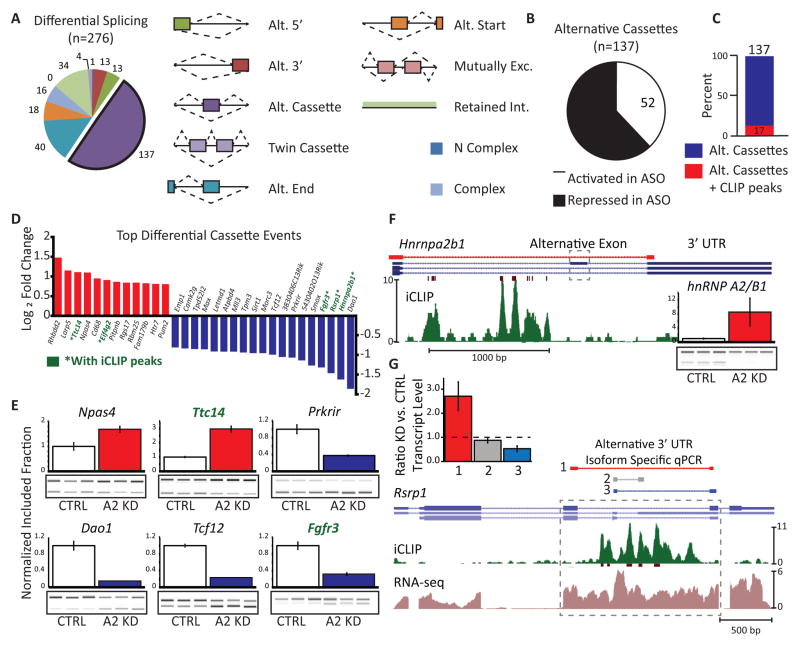
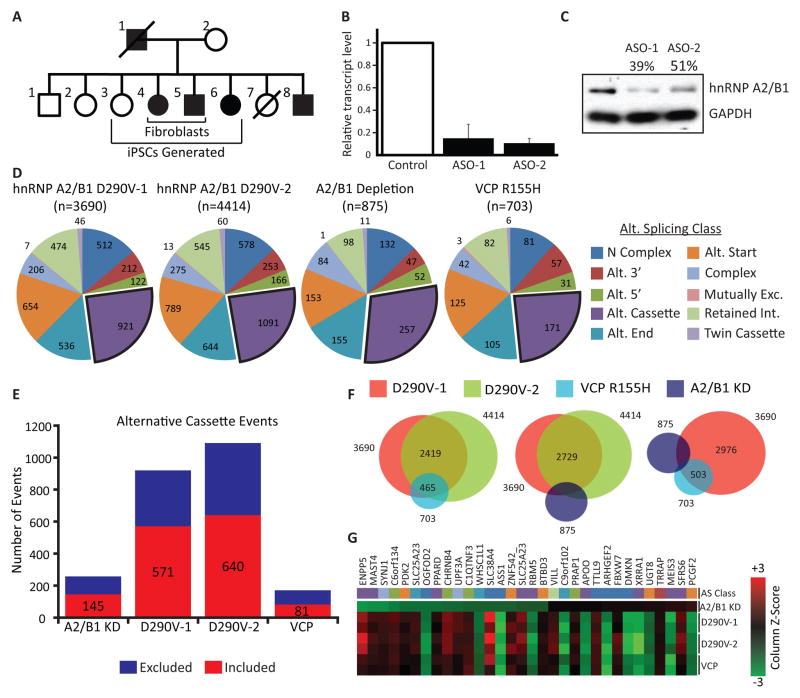
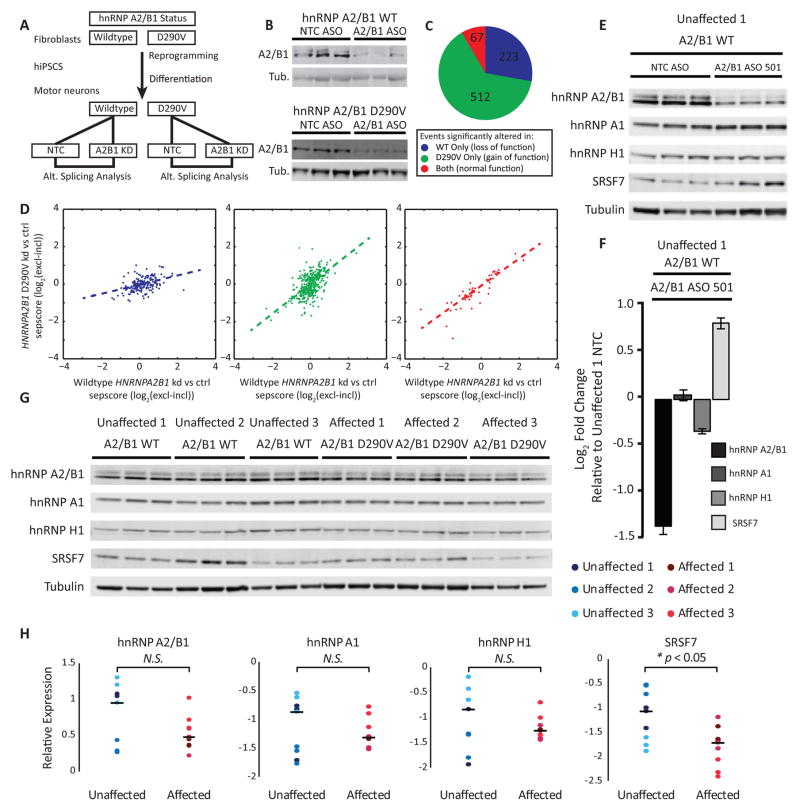
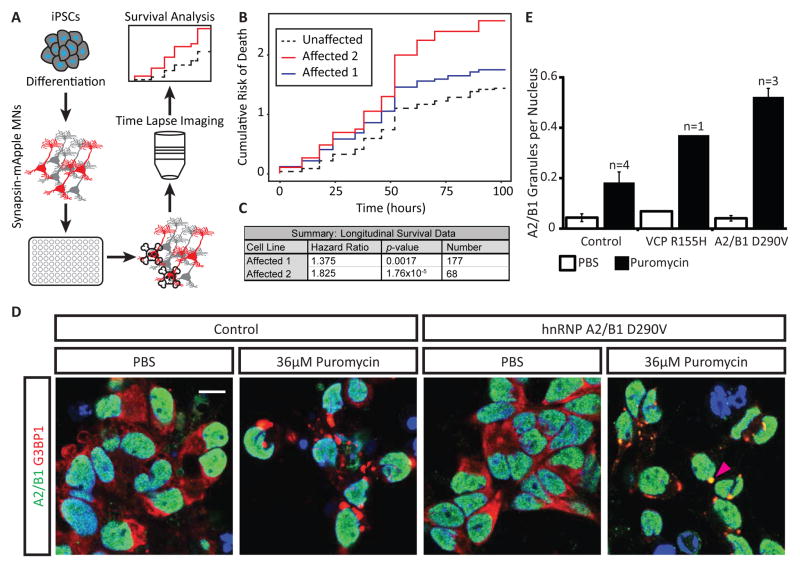
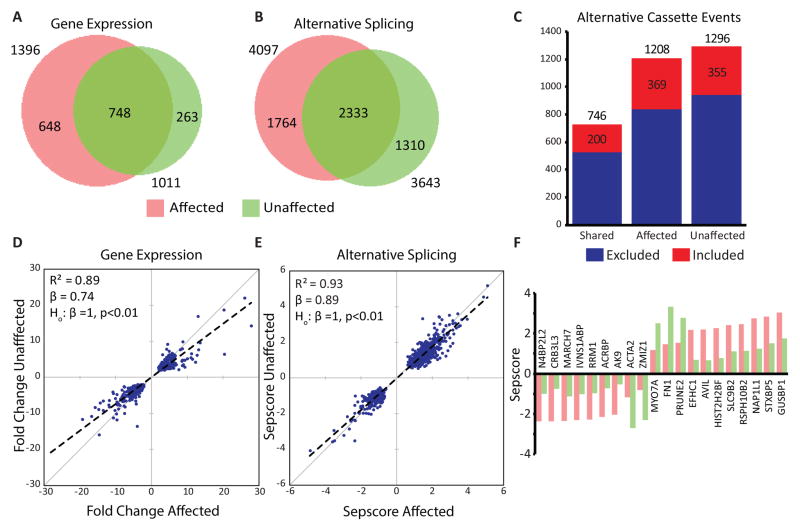
HnRNPA2B1 encodes an RNA binding protein associated with neurodegeneration. However, its function in the nervous system is unclear. Transcriptome-wide crosslinking and immunoprecipitation in mouse spinal cord discover UAGG motifs enriched within ∼2,500 hnRNP A2/B1 binding sites and an unexpected role for hnRNP A2/B1 in alternative polyadenylation. HnRNP A2/B1 loss results in alternative splicing (AS), including skipping of an exon in amyotrophic lateral sclerosis (ALS)-associated D-amino acid oxidase (DAO) that reduces D-serine metabolism. ALS-associated hnRNP A2/B1 D290V mutant patient fibroblasts and motor neurons differentiated from induced pluripotent stem cells (iPSC-MNs) demonstrate abnormal splicing changes, likely due to increased nuclear-insoluble hnRNP A2/B1. Mutant iPSC-MNs display decreased survival in long-term culture and exhibit hnRNP A2/B1 localization to cytoplasmic granules as well as exacerbated changes in gene expression and splicing upon cellular stress. Our findings provide a cellular resource and reveal RNA networks relevant to neurodegeneration, regulated by normal and mutant hnRNP A2/B1. VIDEO ABSTRACT.


Figures

Figure 1
Figure 1. HnRNP A2/B1 recognizes UAGG and predominantly binds 3′ untranslated regions (3′UTRs)
(A) Experimental approaches. Individual nucleotide crosslinking followed by immunoprecipitation (iCLIP) in mouse spinal cord was used to identify hnRNP A2/B1 protein-RNA binding sites in vivo (left). RNA binding followed by sequencing (RNA bind-n-seq, RBNS) using the recombinant RNA binding domain of hnRNP A2/B1 was used to identify high-affinity RNA motifs in vitro (right). Motifs enriched by both methods were compared. (B) hnRNP A2/B1 iCLIP-derived clusters are enriched in 3′UTRs of protein coding genes (left) when compared to the expected distribution of gene regions (5′ and 3′UTRs, exons, and exon-proximal and distal portions of introns; right). Proximal intron regions are defined as extending up to 2 kb from an exon-intron junction (bottom). (C) The UAGG motif is significantly enriched in clusters from all regions (top) and those restricted to 3′UTRs (bottom). p-values were determined by the HOMER algorithm. (D) Hexamers from RNA sequences found by RBNS and iCLIP that contain UAGG are significantly enriched (red dots) compared to those that did not contain UAGG (black dots). p-values were calculated by a Kolmogorov-Smirnov test on the distributions represented by UAGG (red) and other k-mers (black). (E–J) Genome browser views of CLIP reads (green, plotted in the positive direction of the y axis) and clusters (maroon) mapped to selected genes characteristic of the spinal cord (blue). y axes are scaled to the read numbers indicated to the right of each plot. In (H), alternative transcript isoforms are indicated in light blue. Reads from strand-specific RNA-seq analyses are plotted in mauve in the negative direction of the y axis in (F), (H) and (I). (E) – (I) show iCLIP analyses from mouse spinal cord; (J) shows eCLIP analysis from human iPSC-derived motor neurons, represented as log2 ratio of antibody-enriched immunoprecipitate (IP) over size-matched input. The dark green track is eCLIP reads enriched in IP. The light green track is eCLIP reads enriched in input. The vertical axes denote RPM.
Figure 2
Figure 2. HnRNP A2/B1 depletion results in alternative polyadenylation changes
(A) Experimental approach. An antisense oligonucleotide (ASO) targeting the Hnrnpa2b1 transcript, or a vehicle control (saline) solution, was injected into the lateral ventricles of mice (n = 4 mice per treatment) and RNA was isolated from spinal cords 28 days post-injection. (B) Western blotting shows that ASO treatment leads to a ~75% reduction in hnRNP A2/B1 protein levels compared to saline controls. Tubulin was the loading control. (C–D) Statistically significant changes in transcript levels were identified for 17 and 27 genes when analyzed by RNA-seq (C) and microarray (D), respectively. Down- and upregulated genes are indicated in black and white, respectively. Significance was defined using a false-discovery rate threshold of 0.05 for Benjamini-Hochberg corrected values for multiple hypothesis testing. (E) Quantitative RT-PCR validation of the results from (C) and (D) confirmed increased transcript levels for nine of ten genes, including Srsf7, Hnrnpa1, Hnrnph and Hnrnpf (left), and decreased transcript levels for all ten genes, including Hnrbpa2b1 itself (right), upon ASO-mediated depletion of hnRNP A2/B1. Tbp was the reference gene. (F) DaPars analysis of RNA-seq data from the mouse spinal cord samples revealed that depletion of hnRNP A2/B1 leads to changes in poly(A) site (PAS) utilization. The scatterplot of distal PAS (dPAS) usage indexes (PDUIs) in control and hnRNP A2/B1 depletion samples is shown. Significantly (FDR < 0.05, |ΔPDUI| ≥ 0.2, and |dPDUI| ≥ 0.2) shortened and lengthened transcripts are colored in red and blue, respectively. Gray dots indicate transcripts that did not pass the significance threshold. (G) Upon hnRNP A2/B1 depletion, 3′UTR shortening and lengthening was observed for 20 and 61 transcripts, respectively. (H) Of the 81 transcripts displaying differential PAS utilization, 40 contained significant hnRNP A2/B1 occupancy in their 3′UTRs, as identified by iCLIP. (I–J) Examples of genes with differential PAS utilization that are bound by hnRNP A2/B1 in their 3′UTRs. Regions of alternative usage are highlighted in blue (control) and red (ASO treated) in the corresponding RNA-seq track. Vertical axes are RPM.
Figure 3
Figure 3. HnRNP A2/B1 depletion in mouse spinal cord affects alternative splicing
(A) Pie chart shows the classification of 276 significantly changing (q value < 0.05, sepscore > 0.5) splicing events identified by splicing-sensitive microarray. The legend illustrates the types of splicing events represented on the array. (B) 137 alternative cassette events are altered upon loss of hnRNP A2/B1. 85 events were repressed upon knockdown and 52 were activated. (C) Of the 137 transcripts displaying differential inclusion of cassette exons, 17 contained significant hnRNP A2/B1 occupancy, as identified by iCLIP. (D) Ranked list of the 30 alternative cassette events with the largest absolute fold change. Activated cassettes are in red. Repressed cassettes are in blue. Gene names shown in green have significant hnRNP A2/B1 occupancy, as identified by iCLIP. (E) RT-PCR validation of six alternative cassette events. Samples from control mice (white bars) are normalized to 1. Samples from ASO treated mice are shown in red (activated) and blue (repressed). Of the four samples from each treatment group used to generate the bar graphs, three are shown in the gel images that were used to generate the bar graphs. Error bars are SEM computed with four replicates per condition. (F) The alternative exon (dashed box) regulated by hnRNP A2/B1 within its own 3′UTR has nearby iCLIP clusters. Color coding of the browser tracks is as in Figures 1E–J. The red browser track shows the position of PCR primers used for validation. Inset: RT-PCR validation of the event. Bars are as in Figure 3E. (G) An example of alternative 3′UTR usage (gray box) regulated by hnRNP A2/B1, in the Rsrp1 gene with nearby iCLIP clusters. Color coding of the browser tracks is as in Figures 1E–J. The red, gray and green lines above the gene models indicate the position of primers used for qPCR validation. Colors correspond to the bar graph in the inset. Inset: qPCR validation of alternative 3′UTR usage. Tbp was used as the reference gene. Error bars are SEM computed with three replicates per condition.
Figure 4
Figure 4. hnRNP A2/B1-dependent AS in the D-amino acid oxidase (DAO) gene results in reduced DAO protein expression and enzymatic activity
(A) Gene models of the long and short mRNA isoforms produced by AS of the hnRNP A2/B1-dependent cassette exon (in white) in the Dao pre-mRNA. Unaffected exons are shown as black boxes. Introns and UTRs are shown as thin boxes and lines, respectively. The lengths of the predicted protein products are indicated. Amino acid (AA). (B) The transcript levels of Dao mRNA in control and hnRNP A2/B1 depleted mouse spinal cord (n = 4 mice per group) determined by qPCR. Tbp was used as reference. Error bars are SEM computed with four replicates. The mean transcript level for the control mice is normalized to 1. (C) Gel-like image of AS of the Dao cassette exon in mice, determined by RT-PCR, shows exon exclusion upon hnRNP A2/B1 depletion. (D) Western blotting shows a reduction in DAO protein levels to ~70% of non-target control levels in mice treated with hnRNP A2/B1 targeting ASO. Actin was the loading control. (E) X-ray crystallography structure of human DAO (left; Protein Database ID 2E48, Kawazoe et al. (2006)) and the predicted structure of the short isoform (right). The arrows denote two alpha helices and three beta sheets that are absent in the predicted shorter isoform. (F) Schematic of constructs used to express DAO long and short isoforms in stable cell lines. Western blotting shows reduced protein levels in clones expressing the short isoform. Tubulin was the loading control. (G) No difference in transcript level of Dao mRNA from the clones shown in (F) determined by qPCR. Tbp was used as a reference transcript. Error bars are SEM computed with four replicates per condition. (H) DAO activity in the clones shown in (F). Bars represent the ratio of substrate to non-substrate dependent activity. Error bars are SEM computed with four replicates per condition. (I) Western blotting of DAO protein translated in rabbit reticulocyte lysate reveals similar levels in cells expressing either isoform. (J) DAO activity in the lysates shown in (J). The wedge below the bars denotes serial two-fold dilutions of the lysates. (K) Depletion of hnRNP A2/B1 in the human U-251 glioblastoma cell line. Three different targeting shRNAs and one non-targeting control shRNA plasmids were used in triplicates. Splicing-sensitive RT-PCR (top) for DAO shows that under conditions where the short DAO isoform cannot be detected in the NTC-shRNA treated samples, the short DAO isoform was consistently detected in samples treated with the two most effective shRNA constructs. hnRNP A2/B1 depletion was verified by western blotting (bottom). Tubulin was the loading control.
Figure 5
Figure 5. Fibroblasts from patients with mutations in HNRNPA2B1 and VCP exhibit widespread splicing defects
(A) A multiplex family affected by MSP, where affected (filled in black) individuals harbor p.D290V mutations in the HNRNPA2B1 gene. Fibroblasts and iPSCs used in experiments in Figures 5–7 were obtained from the indicated individuals. (B) Depletion of HNRNPA2B1 mRNA in fibroblasts from an unaffected individual by treatment with ASOs, as measured by qPCR using GAPDH as reference. Error bars are SEM computed with three replicates per condition. The control transcript level is normalized to 1. The error for the control samples was added to the error for the other conditions by error propagation. (C) Western blot analysis showing successful depletion of hnRNP A2/B1 protein. GAPDH was the loading control. (D) Splicing-sensitive microarrays detected splicing changes in fibroblasts obtained from individuals with the indicated genotype. hnRNP A2/B1 depletion is from samples in Figures 5B and 5C. Significant splicing changes are determined by comparing to two different unrelated control samples. Color coding and splicing event categories are as in Figure 3A. (E) Quantification of alternative cassette events detected in the various samples. Colors indicate the direction of the splicing change. Excluded refers to excluded in the depleted or affected sample. Included refers to included in the depleted or affected sample. (F) Venn diagrams illustrating overlapping splicing events between the indicated groups. Overlapping events refers to identical splicing events flagged as significant in two or more samples, regardless of the directionality of the changes. (G) Heat map of 32 splicing changes that were flagged as significant in all four groups. Red changes are activated compared to controls. Green changes are repressed. Color mapping is performed according to the column-wise Z-score.
Figure 6
Figure 6. iPSC-MNs from patients with mutations in HNRNPA2B1 exhibit splicing defects
(A) Schematic of experimental design. Fibroblasts expressing wildtype and hnRNP A2/B1 D290V were reprogrammed to iPSCs. iPSCs were differentiated to motor neurons. Motor neurons were treated with ASO against HNRNPA2B1 or non-targeting control (NTC). ASO treated and NTC treated RNA from both individuals was subjected to splicing sensitive microarray analysis. (B) Depletion of hnRNP A2/B1 protein by ASO in motor neurons confirmed by western blotting. Tubulin (Tub.) was the loading control. (C) Classification of 802 alternative cassette splicing changes into loss of function, gain of function, or normal function based on whether the event was detected in one genotype only, or both. (D) Scatterplots comparing the sepscore (ASO vs. NTC) for WT HNRNPA2B1 vs. HNRNPA2B1 p.D290V. Dotted line is the least squares linear regression. The colors denote events detected in the WT sample only (blue), the mutant sample (green), or both samples (red). See the Supplemental Experimental Procedures for a definition of sepscore. (E) Western blotting for hnRNP A2/B1, hnRNP A1, hnRNP H1 and SRSF7 after ASO-mediated hnRNP A2/B1 depletion, or non-targeting control (NTC) ASO, in iPSC-MNs from an unaffected individual. Tubulin was the loading control. Each lane represents a technical replicate of ASO treatment. (F) Densitometry quantitation of the blot in (E) shows efficient depletion of hnRNP A2/B1, a small decrease in levels of hnRNP H1 and a modest increase in levels of SRSF7. Averages are plotted with error bars representing SEM. Three replicates per condition. (G) Western blots of hnRNP A2/B1, hnRNP A1, hnRNP H1 and SRSF7 in iPSC-MNs from three unaffected and three affected individuals. Tubulin served as a loading control. Each lane contains lysate from a separate tissue culture well. (H) Densitometry quantitation of the blot in (G). Dots represent band intensities normalized to tubulin loading control, color-coded according to the individual. Lines represent the median levels across all nine samples for each indicated protein. A two sample, two tailed, homoscedastic t-test was performed with n = 9 to generate the relevant p-values.
Figure 7
Figure 7. hnRNP A2/B1 D290V motor neurons exhibit increased risk of death and accumulate excess hnRNP A2/B1 in stress granules
(A) Schematic of experimental design for long term imaging and survival analysis. iPSCs from affected and unaffected individuals were differentiated into iPSC-MNs, transfected with Synapsin-mApple and plated in 96-well plates. Fluorescent cells were tracked over time using time lapse imaging. Survival of motor neurons was evaluated using Kaplan-Meier analysis. (B) Cumulative risk of death curves derived from Kaplan-Meier survival curves for iPSC-MNs differentiated from two affected (hnRNP A2/B1 D290V) and two unaffected individuals. Data was recorded over four days. Cells from both unaffected individuals are combined into a single line for analysis purposes. (C) Summary of Cox proportional hazard analysis of survival data depicted in (B). Affected cells have a significantly higher hazard ratio compared to unaffected cells. A hazard ratio greater than 1.0 indicates increased risk of death as compared to the control lines from healthy individuals. See supplemental experimental procedures for a discussion of hazard ratio and p-value calculations. (D) Immunofluorescence staining of hnRNP A2/B1 and the stress granule marker G3BP1 in iPSC-MNs from an unaffected and an affected individual. iPSC-MNs from both individuals accumulate foci positive for G3BP1 when treated with puromycin, but not vehicle (PBS). iPSC-MNs derived from the affected individual also accumulate hnRNP A2/B1 in the foci. White arrow: G3BP1 positive stress granule. Magenta arrow: G3BP1 and hnRNP A2/B1 positive stress granule. Scale bar = 10 μm. (E) Quantification of images in (A). hnRNP A2/B1 positive granules per nucleus were counted. “n” refers to the number of individuals analyzed with each genotype. Error bars are SEM computed with the indicated sample size.
Figure 8
Figure 8. iPSC-MNs from affected patients display an exaggerated response to stress
(A–B) Venn diagrams showing the overlap of stress-induced gene expression (A) and AS (B) changes between iPSC-MNs from four affected (pink) and three unaffected (green) individuals. For both analyses, a plurality of events is shared. (C) For each group in (B), the type of alternative cassette exon events (excluded vs. included) were counted. Most stress-induced changes are exon-skipping in all groups. (D–E) Scatterplots generated by calculating the median magnitude change from affected (x axis) and unaffected (y axis) samples for each shared event shown in (A–B). Dashed lines represent the fit obtained by linear regression, with the coefficient of determination (R2) and slope (beta) indicated. A Student’s t-test shows that the slopes are significantly different from one (p < 0.01) for both analyses, indicating that the magnitude of the stress-induced events are more pronounced in affected than in unaffected samples. See Supplemental Experimental Procedures for a definition of sepscore. (F) The 20 splicing changes with the largest difference in Sepscore between affected and unaffected samples are plotted along with the genes they are found in. While the direction (exclusion vs. inclusion) is the same regardless of disease status, for 15 of the 20 events the magnitudes of the stress-induced splicing changes were larger in affected samples than in unaffected samples.

References

    1. Ainger K, Avossa D, Diana AS, Barry C, Barbarese E, Carson JH. Transport and Localization Elements in Myelin Basic Protein mRNA. The Journal of Cell Biology. 1997;138:1077–1087. - PMC - PubMed
    1. Alarcon CR, Goodarzi H, Lee H, Liu X, Tavazoie S, Tavazoie SF. HNRNPA2B1 Is a Mediator of m(6)A-Dependent Nuclear RNA Processing Events. Cell. 2015;162:1299–1308. - PMC - PubMed
    1. Belzil VV, Gendron TF, Petrucelli L. RNA-mediated toxicity in neurodegenerative disease. Mol Cell Neurosci. 2013;56:406–419. - PMC - PubMed
    1. Berson A, Barbash S, Shaltiel G, Goll Y, Hanin G, Greenberg DS, Ketzef M, Becker AJ, Friedman A, Soreq H. Cholinergic-associated loss of hnRNP-A/B in Alzheimer’s disease impairs cortical splicing and cognitive function in mice. EMBO Mol Med. 2012;4:730–742. - PMC - PubMed
    1. Burkhardt MF, Martinez FJ, Wright S, Ramos C, Volfson D, Mason M, Garnes J, Dang V, Lievers J, Shoukat-Mumtaz U, et al. A cellular model for sporadic ALS using patient-derived induced pluripotent stem cells. Mol Cell Neurosci. 2013;56:355–364. - PMC - PubMed

Publication types

MeSH terms

Substances