. 2016 Nov 8;7(5):927-940.
doi: 10.1016/j.stemcr.2016.09.011. Epub 2016 Oct 20.

Marked Differences in C9orf72 Methylation Status and Isoform Expression between C9/ALS Human Embryonic and Induced Pluripotent Stem Cells

Affiliations

Marked Differences in C9orf72 Methylation Status and Isoform Expression between C9/ALS Human Embryonic and Induced Pluripotent Stem Cells

Yaara Cohen-Hadad et al. Stem Cell Reports. .

Abstract

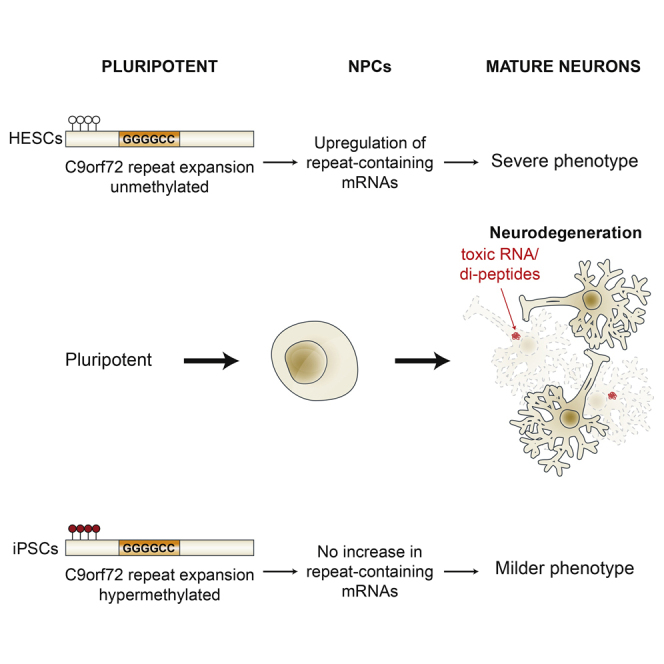
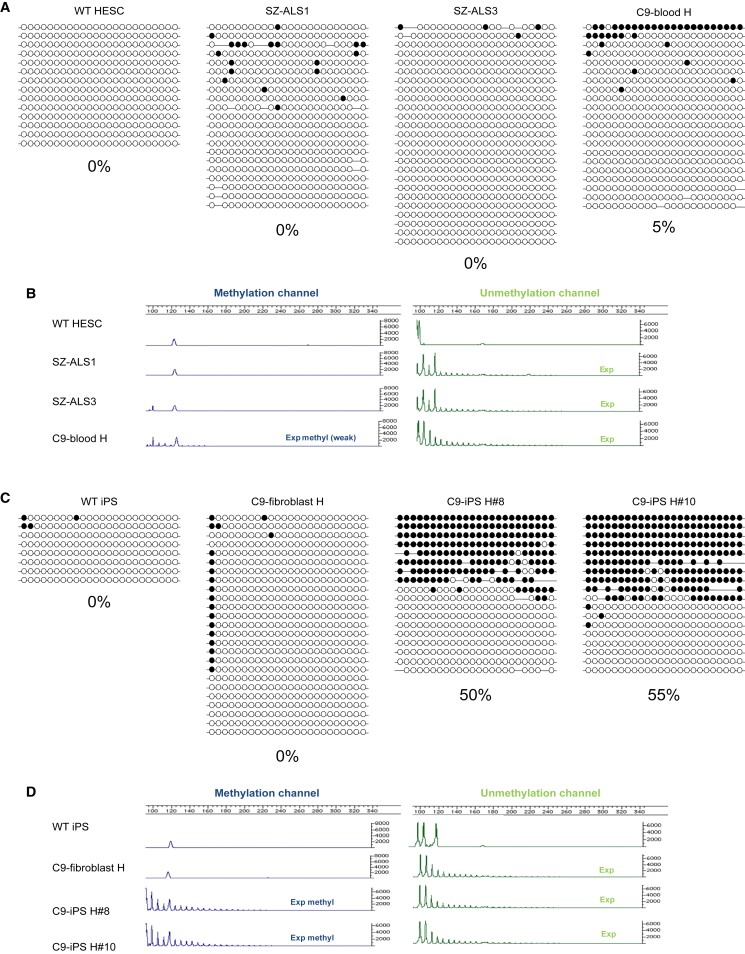
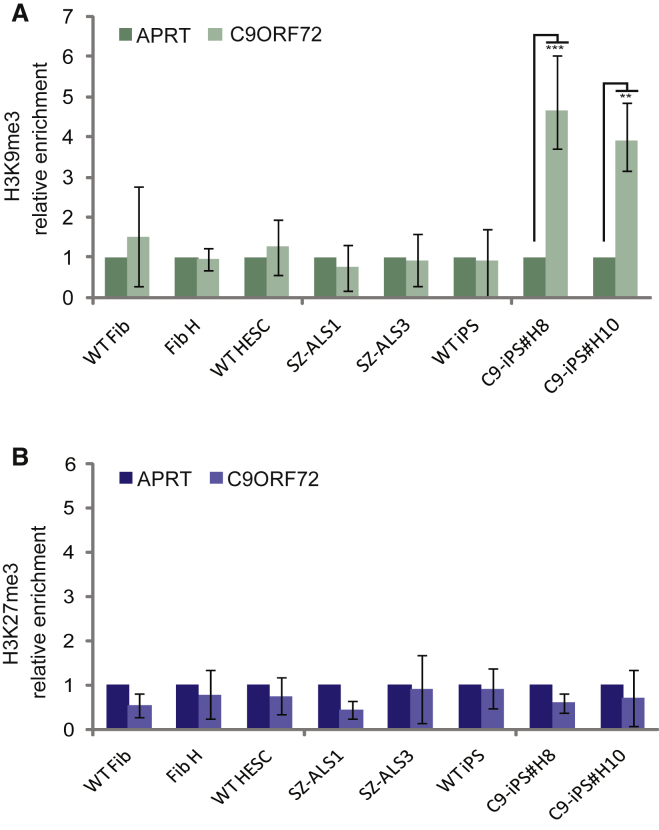
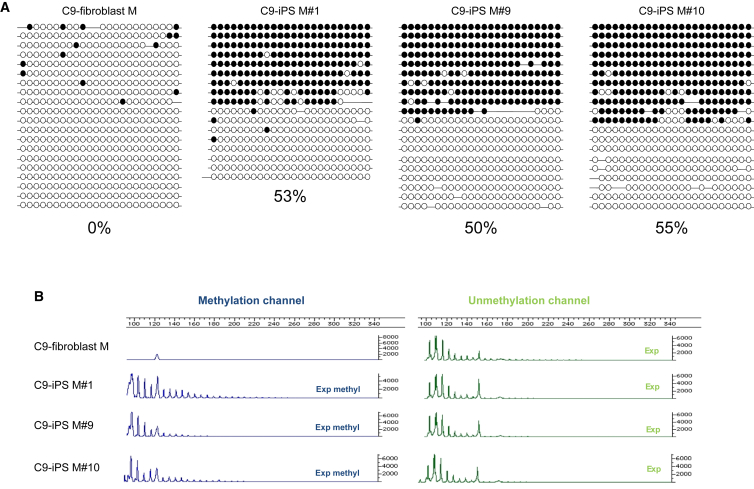
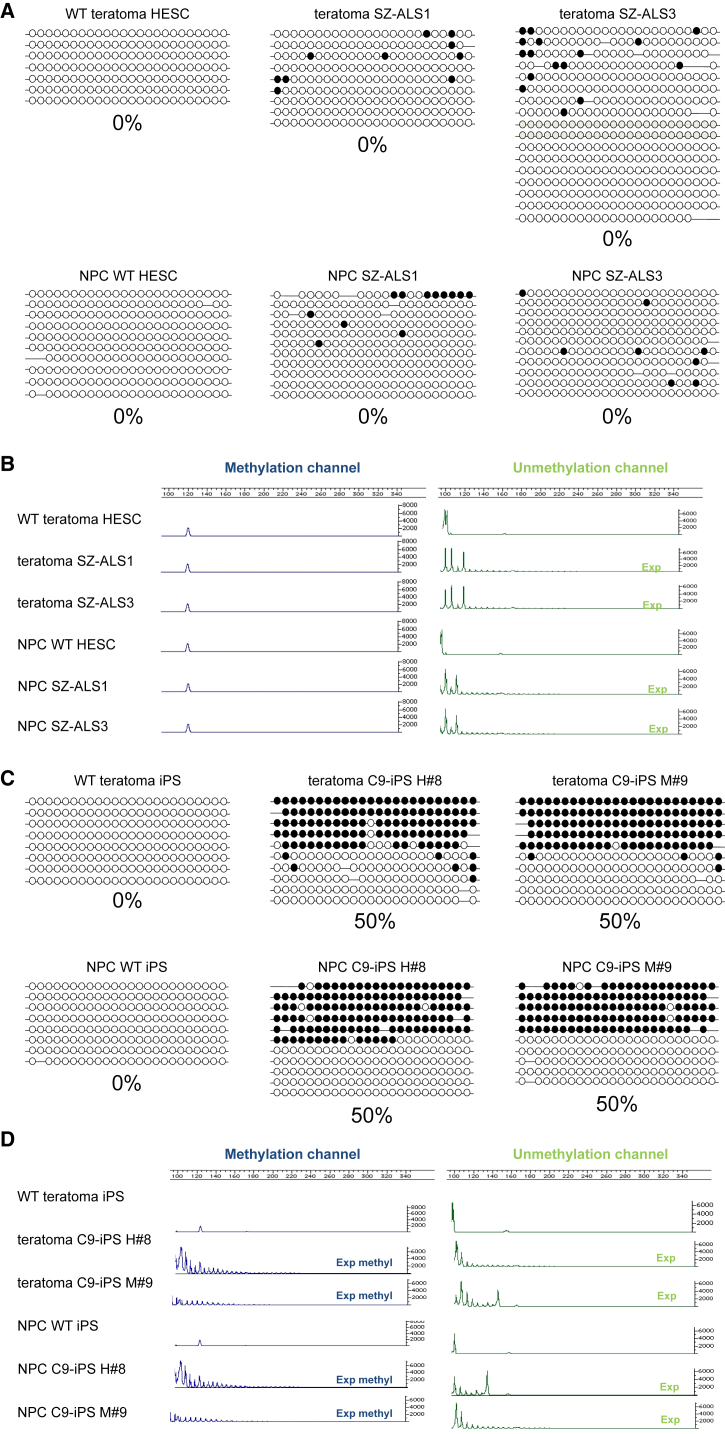
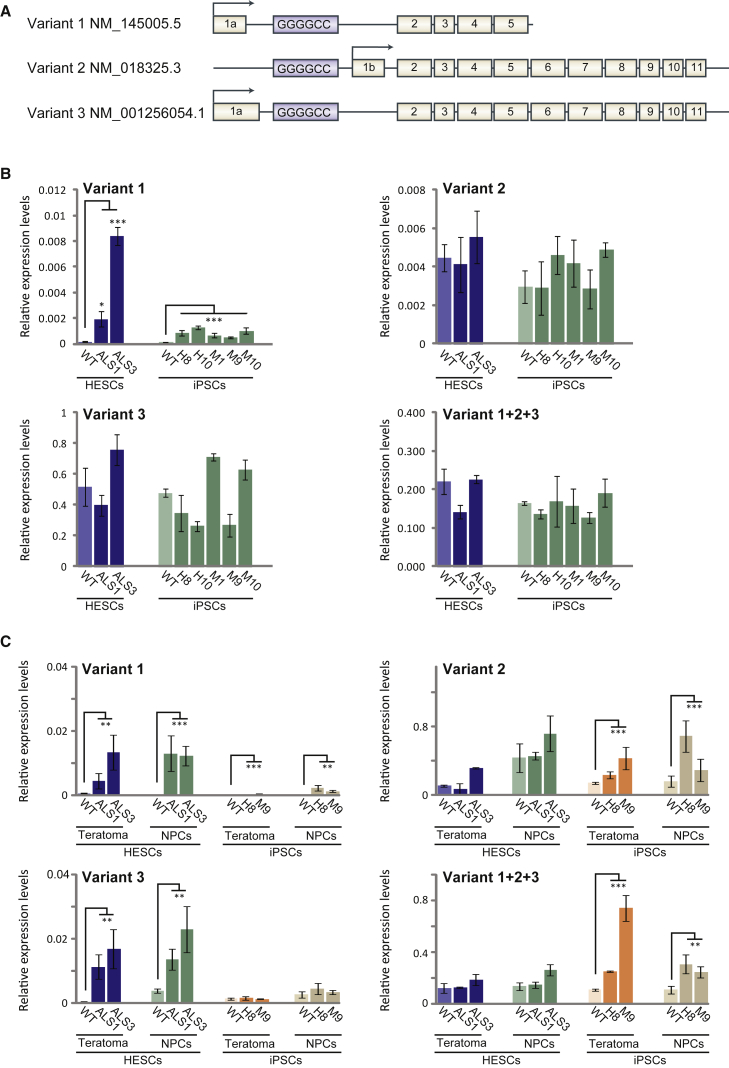
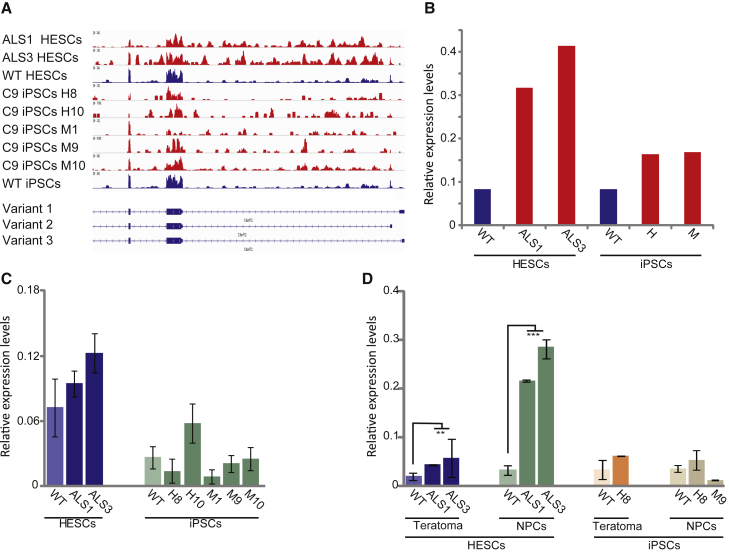
We established two human embryonic stem cell (hESC) lines with a GGGGCC expansion in the C9orf72 gene (C9), and compared them with haploidentical and unrelated C9 induced pluripotent stem cells (iPSCs). We found a marked difference in C9 methylation between the cells. hESCs and parental fibroblasts are entirely unmethylated while the iPSCs are hypermethylated. In addition, we show that the expansion alters promoter usage and interferes with the proper splicing of intron 1, eventually leading to the accumulation of repeat-containing mRNA following neural differentiation. These changes are attenuated in C9 iPSCs, presumably owing to hypermethylation. Altogether, this study highlights the importance of neural differentiation in the pathogenesis of disease and points to the potential role of hypermethylation as a neuroprotective mechanism against pathogenic mRNAs, envisaging a milder phenotype in C9 iPSCs.

Keywords: C9/ALS; CpG islands; DNA methylation; disease modelling; neurodegeneration; pluripotent stem cells; unstable repeat expansions.


Figures

None
Graphical abstract
Figure 1
Figure 1
Analysis of Methylation Levels in the Upstream Region of the G4C2 Repeats and in the G4C2 Repeat Itself in C9 hESCs, Maternal Blood, Primary Fibroblasts, and iPSCs Derived from Them (A) Methylation levels upstream of the repeats were determined by bisulfite sequencing of a region 200 bp upstream of the repeats (altogether 24 CpG sites) in SZ-ALS1, SZ-ALS3, and wild-type (WT) (SZ-13) hESCs and whole blood from the mother (patient H). Each line represents a single DNA molecule (upstream region of the repeats), with methylated and unmethylated CpGs designated by black and white circles, respectively. (B) Results of the (G4C2)n-methylation assay in WT and affected (C9/ALS) hESCs and blood cells of the mother. The left panel (blue channel) represents methylated alleles, while the right panel (green channel) represents unmethylated alleles. (C) Methylation levels upstream to the repeats as determined by single-molecule bisulfite sequencing of the same region shown in (A) in WT iPSCs, C9 parental fibroblasts (from patient H) and iPSCs derived from them (C9-iPS#H8 and iPS#H10). (D) Results of the (G4C2)n-methylation assay in WT and C9 affected cells described in (C).
Figure 2
Figure 2
ChIP Analysis for H3K9me3 and H3K27me3 in WT and C9 Fibroblasts, Undifferentiated hESCs, and iPSCs Real-time PCR ChIP analysis for (A) H3K9me3 and (B) H3K27me3 in WT and C9 affected hESCs (SZ-ALS1 and SZ-ALS3), haploidentical parental fibroblasts (Fib-H), and iPSCs derived from them (C9-iPS #H8 and #H10). APRT was used as a negative control for both modifications. Negative controls were set to 1. The data in each panel represent an average of three to five independent ChIP experiments. Error bars represent SE (paired t test, ∗∗p < 0.01, ∗∗∗p < 0.001).
Figure 3
Figure 3
Analysis of Methylation Levels in the Region Upstream of the G4C2 Repeats and in the G4C2 Repeat Itself in Primary Fibroblasts and iPSCs Derived from Patient M (A) Methylation levels upstream of the repeats were determined by bisulfite sequencing of the same region as in Figure 1A in WT and C9 affected parental fibroblasts derived from a 65-year-old C9/ALS-manifesting patient (patient M) and iPSCs derived from them (C9 iPS#M1, iPS#M9, and iPS#H10). Each line represents the upstream region of the repeats, with methylated and unmethylated CpGs designated by black and white circles, respectively. (B) Results of the (G4C2)n-methylation assay in primary fibroblasts and iPSC clones derived from patient M. Left panel (blue channel) represents methylated alleles while the right panel (green channel) represents unmethylated alleles.
Figure 4
Figure 4
Analysis of Methylation Levels in Neural Precursors and Teratomas Derived from C9 and WT hESCs and iPSCs (A) Methylation levels upstream to the repeats were determined by bisulfite sequencing in teratomas and neural precursor cells (NPC) derived from WT and C9 mutant hESCs (SZ-ALS1 and SZ-ALS3). Each line represents a single DNA molecule (upstream region of the repeats), with methylated and unmethylated CpGs designated by black and white circles, respectively. (B) Results of the (G4C2)n-methylation assay in WT and affected (C9) teratomas and NPCs derived from hESCs. Left panel (blue channel) represents methylated alleles while the right panel (green channel) represents unmethylated alleles. (C) Methylation levels upstream of the repeats were determined by bisulfite sequencing in teratomas and NPCs derived from WT and C9 iPSCs from patient H (C9-iPSC H#8, 700 repeats) and patient M (C9-iPSC M#9, 2,700 repeats). Each line represents a single DNA molecule (upstream region of the repeats), with methylated and unmethylated CpGs designated by black and white circles, respectively. (D) Results of the (G4C2)n-methylation assay in WT and affected (C9/ALS) teratomas and NPCs derived from iPSCs. Left panel (blue channel) represents methylated alleles while right panel (green channel) represents unmethylated alleles.
Figure 5
Figure 5
Analysis of C9orf72 Variant Expression Levels in Undifferentiated and Differentiated Derivatives of hESCs and iPSCs by qRT-PCR (A) Schematic illustration of the three C9orf72 mRNA isoform variants (V1, V2, and V3). (B and C) Mean value of qRT-PCR for C9orf72 transcription in both C9 hESC lines (SZ-ALS1 and SZ-ALS3), C9 iPSC clones derived from patients H (H8, H10) and M (M1, M9, M10), and their WT controls from the TaqMan gene expression assay for C9orf72 transcript variants 1, 2, and 3. mRNA transcription levels were determined in (B) undifferentiated (hESCs and iPSCs) and (C) differentiated cell derivatives (NPCs and teratomas) of C9 mutation carrying cells and appropriate controls (WT hESCs and WT iPSCs). Using TaqMan probes targeting transcript variants 1, 2, and 3 individually (V1, V2, V3) as well as altogether (V1 + V2 + V3), we determined the relative abundance of each transcript variant. The expression level in each cell type represents an average of three to six independent experiments. Cycle threshold (Ct) values were normalized to the corresponding Ct value of GUS. WT hESC line is SZ-13. Error bars represent SE (t test for equal variances, p < 0.05, ∗∗p < 0.01, ∗∗∗p < 0.001).
Figure 6
Figure 6
Expression of Intron 1-Retaining C9orf72 Transcripts in Undifferentiated and Differentiated hESCs and iPSCs (A) Genebrowser view of the first three exons (exons 1a, 1b, 2, and 3) and intronic sequences of C9orf72. (B) Quantification of the intron 1 retention data presented in (A) in undifferentiated WT and C9 hESCs and iPSCs is based on RNA-seq data. C9 iPSC clones from patient H and M were averaged. (C) Relative expression levels of intron 1-retaining exon 1a-initiating transcripts as determined by real-time RT-PCR in undifferentiated C9 hESCs (SZ-ALS1 and SZ-ALS3), C9 iPSC clones, and their appropriate WT controls. (D) Relative expression levels of intron 1-retaining exon 1a-initiating transcripts as determined by real-time RT-PCR in teratomas and NPCs derived from C9 hESCs (SZ-ALS1 and SZ-ALS3), C9 iPSC clones, and their appropriate WT controls. The expression level in each cell type represents an average of three to six independent experiments. In (C) and (D), Ct values were normalized to the corresponding Ct value of GUS. WT hESC line is SZ-13. Error bars represent SE (t test for equal variance, ∗∗p < 0.01, ∗∗∗p < 0.001).

Similar articles

Cited by

References

    1. Almeida S., Gascon E., Tran H., Chou H.J., Gendron T.F., Degroot S., Tapper A.R., Sellier C., Charlet-Berguerand N., Karydas A. Modeling key pathological features of frontotemporal dementia with C9ORF72 repeat expansion in iPSC-derived human neurons. Acta Neuropathol. 2013;126:385–399. - PMC - PubMed
    1. Avitzour M., Mor-Shaked H., Yanovsky-Dagan S., Aharoni S., Altarescu G., Renbaum P., Eldar-Geva T., Schonberger O., Levy-Lahad E., Epsztejn-Litman S. FMR1 epigenetic silencing commonly occurs in undifferentiated fragile X-affected embryonic stem cells. Stem Cell Rep. 2014;3:699–706. - PMC - PubMed
    1. Bauer P.O. Methylation of C9orf72 expansion reduces RNA foci formation and dipeptide-repeat proteins expression in cells. Neurosci. Lett. 2016;612:204–209. - PubMed
    1. Belzil V.V., Bauer P.O., Prudencio M., Gendron T.F., Stetler C.T., Yan I.K., Pregent L., Daughrity L., Baker M.C., Rademakers R. Reduced C9orf72 gene expression in c9FTD/ALS is caused by histone trimethylation, an epigenetic event detectable in blood. Acta Neuropathol. 2013;126:895–905. - PMC - PubMed
    1. Belzil V.V., Bauer P.O., Gendron T.F., Murray M.E., Dickson D., Petrucelli L. Characterization of DNA hypermethylation in the cerebellum of c9FTD/ALS patients. Brain Res. 2014;1584:15–21. - PMC - PubMed

Publication types

Substances