. 2016 Nov 8;7(5):983-997.
doi: 10.1016/j.stemcr.2016.09.009. Epub 2016 Oct 20.

Transcriptional and Chromatin Dynamics of Muscle Regeneration after Severe Trauma

Affiliations

Transcriptional and Chromatin Dynamics of Muscle Regeneration after Severe Trauma

Carlos A Aguilar et al. Stem Cell Reports. .

Abstract

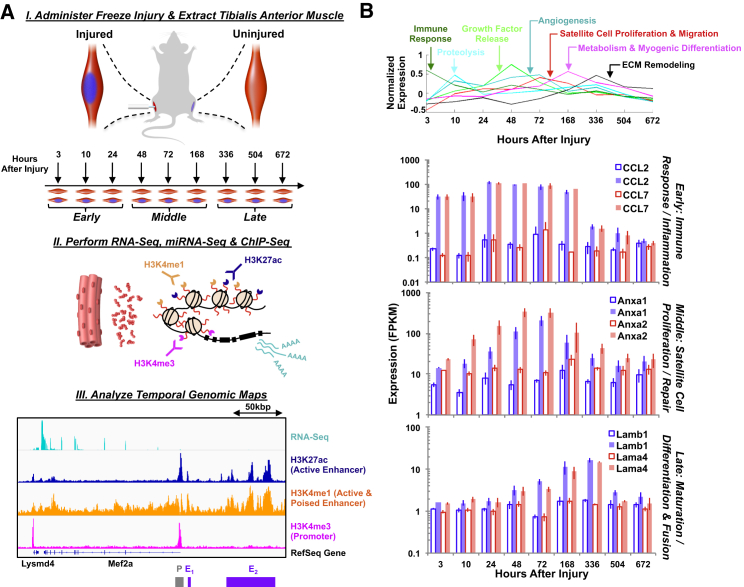
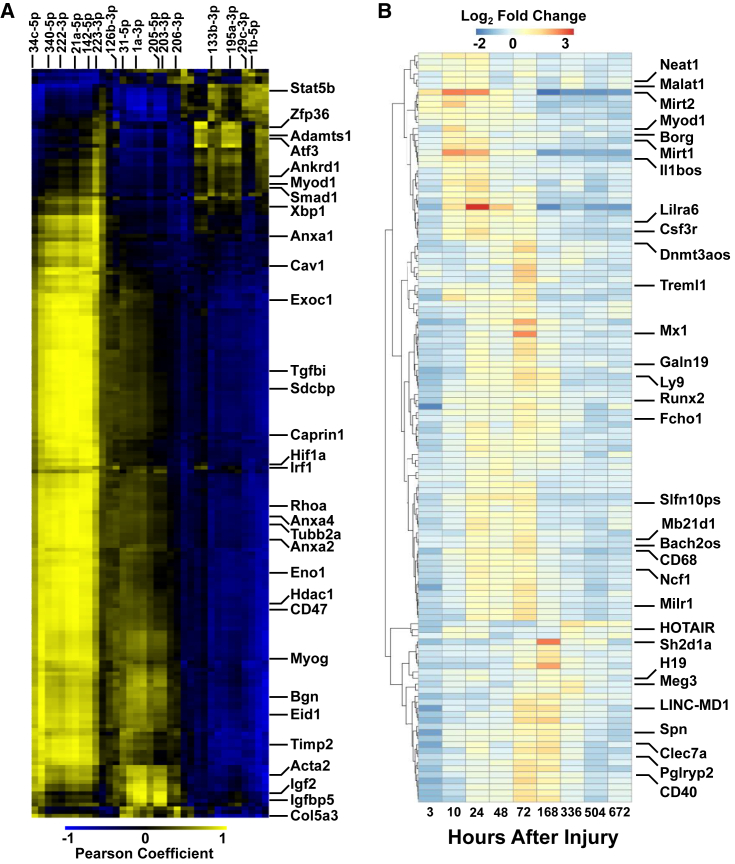
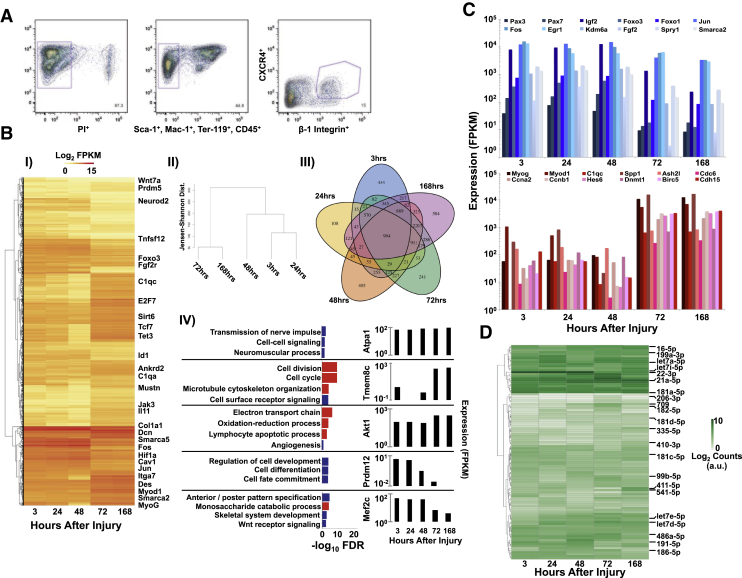
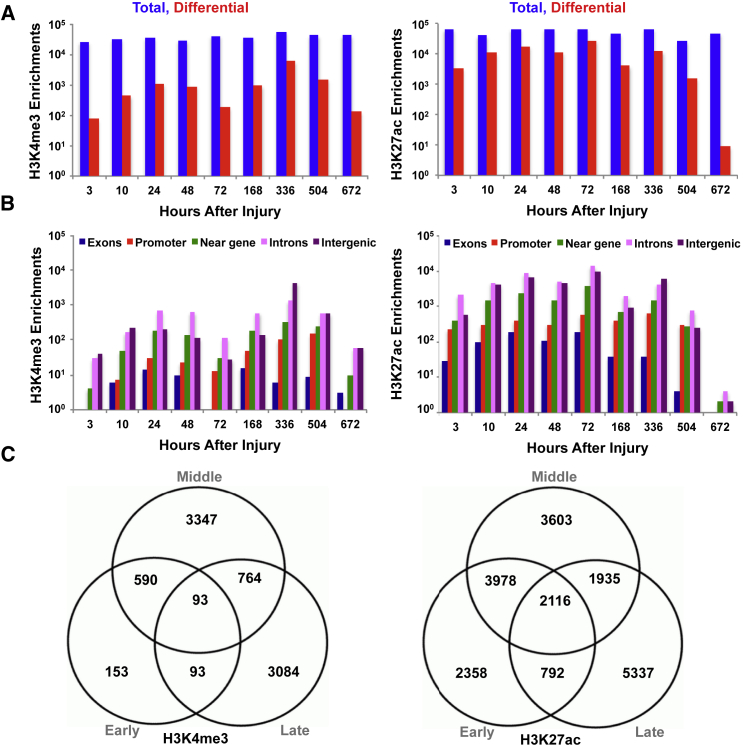
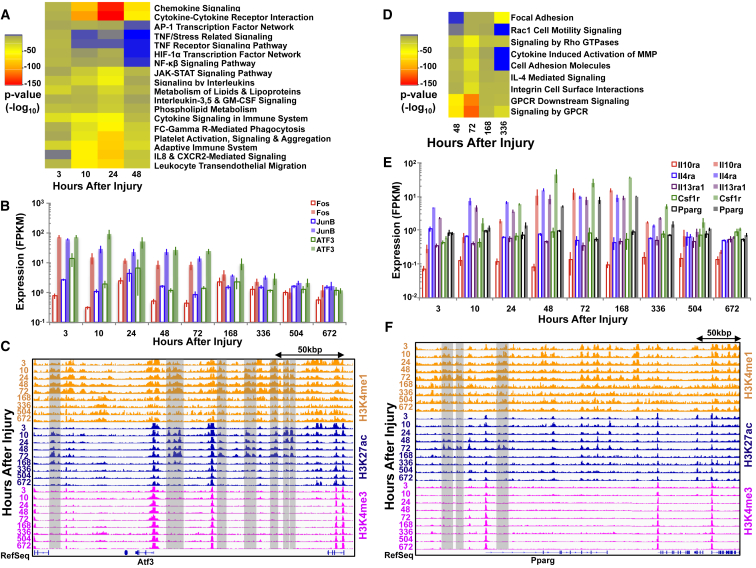
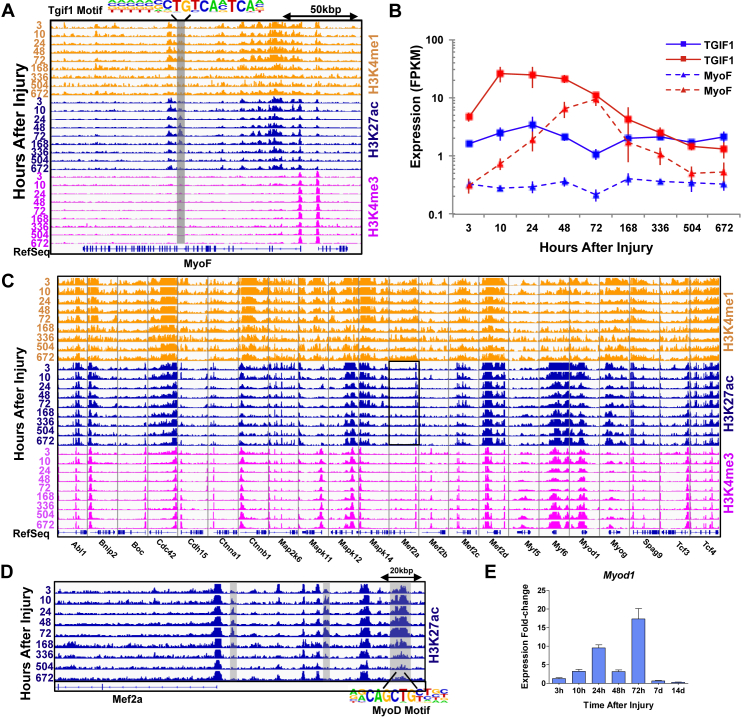
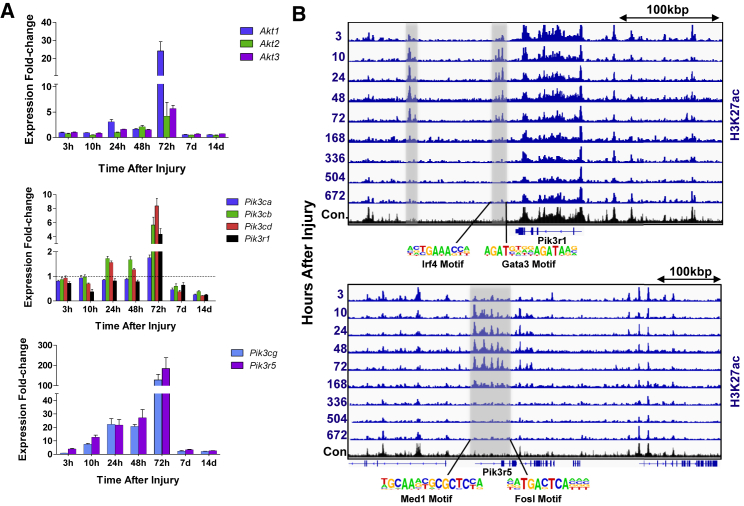
Following injury, adult skeletal muscle undergoes a well-coordinated sequence of molecular and physiological events to promote repair and regeneration. However, a thorough understanding of the in vivo epigenomic and transcriptional mechanisms that control these reparative events is lacking. To address this, we monitored the in vivo dynamics of three histone modifications and coding and noncoding RNA expression throughout the regenerative process in a mouse model of traumatic muscle injury. We first illustrate how both coding and noncoding RNAs in tissues and sorted satellite cells are modified and regulated during various stages after trauma. Next, we use chromatin immunoprecipitation followed by sequencing to evaluate the chromatin state of cis-regulatory elements (promoters and enhancers) and view how these elements evolve and influence various muscle repair and regeneration transcriptional programs. These results provide a comprehensive view of the central factors that regulate muscle regeneration and underscore the multiple levels through which both transcriptional and epigenetic patterns are regulated to enact appropriate repair and regeneration.


Figures

Figure 1
Figure 1
Experimental Overview for Profiling Molecular Mechanisms Governing In Vivo Tibialis Anterior Muscle Regeneration after Severe Trauma (A) Schematic diagram of injury model and process flow for chromatin and transcript extraction. A representative example of the Mef2a gene at 3 hr post injury is shown where the promoter (labeled P in gray) and enhancer regions (labeled E1 and E2 in purple) are depicted. (B) (Top) Line plots of hierarchically clustered RNA-seq data through time revealed clusters up- and downregulated at different time periods that were associated with different stages of muscle repair and regeneration. (Bottom) Bar graphs of gene expression values of six different genes corresponding to different stages of the muscle regeneration process through time from left to right. Error bars represent 1 SD.
Figure 2
Figure 2
Dynamics of Noncoding RNAs after Severe Muscle Trauma (A) Cross-correlation analysis of dynamic miRNAs and their mRNA targets. The heatmap is plotted as the Pearson correlation coefficient of the expression of 35 dynamic miRNAs (x axis) against the expression of their 200 predicted mRNA targets (y axis). A positive correlation coefficient is labeled in yellow and a negative correlation coefficient in blue. (B) Expression heatmap of 124 lncRNAs through time from left to right. Heatmap is depicted as fold change of injured versus uninjured.
Figure 3
Figure 3
Temporal Coding and Noncoding Transcriptional Signatures of Sorted Satellite Cells Post Trauma Highlights Regenerative Transitions (A) Representative isolation plot of FACS of satellite cells for Sca-1, CD45, Mac-1, Ter-119, β1-integrin+, and Cxcr4+. Purple gates indicate subpopulations containing satellite cells and numbers specify percentage of cells within gate. (B) (I) Expression heatmap of 994 representative differentially expressed genes through time where yellow is low expression and red is high expression. (II) Dendrogram showing global hierarchical clustering of RNA-seq datasets separated by their Jensen-Shannon distance. (III) Venn diagram of unique and overlapping differentially expressed genes for the time points sampled. (IV) Left: bar graphs of false discovery rates for over-represented GO pathways derived from hierarchical clustering. Blue bars are upregulated GO terms and red bars are downregulated GO terms. Right: bar plots of RNA expression profiles of representative genes from each cluster are plotted to the right of each cluster through time from left to right. FPKM, fragments per kilobase of transcript per million mapped reads. (C) Bar graphs of individual gene expression values through time from left to right. (D) Expression heatmap of 107 differentially expressed miRNAs observed where white is low expression and green is high expression.
Figure 4
Figure 4
Distribution of Enriched Chromatin Sites across the Genome during In Vivo Muscle Regeneration (A) Total and differential number of enriched sites for H3K4me3 and H3K27ac. (B) Distribution of peaks across various genomic elements (promoter, intergenic, intron, near-gene: ± 2 kbp from transcriptional start site, exon). (C) Shared and unique numbers of enriched chromatin sites corresponding to different genomic elements in (B).
Figure 5
Figure 5
Chromatin Landscapes Are Immediately Modified after Severe Muscle Trauma and Reflect Recruitment of Different Types of Immune Cells (A) Heatmap of p values for over-represented pathways derived from enriched H3K27ac peaks in the early time period (3–48 hr). AP-1, activator protein 1; CXCR2, C-X-C motif chemokine receptor 2; FC gamma R, Fc-γ receptor; GM-CSF, granulocyte macrophage colony-stimulating factor; HIF-1α, hypoxia-inducible factor 1α; IL8, interleukin-8; NF-κβ, nuclear factor κB; TNF, tumor necrosis factor. (B) Bar graphs of individual gene expression values through time from left to right of immune-cell related transcripts upregulated in the early period (injured samples are colored and uninjured samples are uncolored). Error bars represent 1 SD. (C) Normalized ChIP-seq tracks of H3K4me1, H3K27ac, and H3K4me3 profiles around the Atf3 gene. Enriched enhancer regions are highlighted in gray. (D) Heatmap of over-represented pathways derived from enriched H3K27ac peaks in the middle time period (48–336 hr). GPCR, G-protein-coupled receptor; IL-4, interleukin-4; MMP, matrix metalloprotein. (E) Histograms of individual gene expression values through time from left to right of anti-inflammatory related transcripts. Interleukin-4 receptor α (Il4ra), interleukin-10 receptor α (Il10ra), and interleukin-13 receptor α 1 (Il13ra1), colony-stimulating factor 1 receptor (Csf1r), and peroxisome proliferator-activated receptor γ (Pparg). Error bars represent 1 SD. (F) Normalized ChIP-seq tracks of H3K4me1, H3K27ac, and H3K4me3 profiles around the Ppar-γ gene. Enriched enhancer regions are highlighted in gray.
Figure 6
Figure 6
Chromatin State Transitions Associated with Activation of Basement Membrane Repair and Myogenic Regeneration (A) Normalized ChIP-seq tracks of H3K4me1, H3K27ac, and H3K4me3 profiles around the myoferlin (MyoF) gene. Enriched enhancer regions are highlighted in gray and corresponding enriched TF motif is labeled. (B) Line graphs of individual gene expression values of MyoF and associated transcription factor (Tgif1) through time from left to right (injured samples are colored red and uninjured samples are colored blue). Error bars represent 1 SD. (C) Normalized ChIP-seq tracks of H3K4me1, H3K27ac, and H3K4me3 profiles for a subset of myogenesis genes. The black box outlines the H3K27ac region, which is expanded in (D) and illustrates the Mef2a locus. (D) Normalized H3K27ac ChIP-seq track highlighting enriched enhancers around the Mef2a gene. The enriched enhancer regions are highlighted in gray and corresponding enriched TF motif (MyoD) is labeled beneath the track. (E) Bar graph of expression for MyoD. Error bars represent SEM.
Figure 7
Figure 7
PI3K/Akt Activation Promotes Transition from Proliferation toward Myogenic Differentiation (A) Bar graphs of individual gene expression values for various components of the PI3K and AKT pathways through time from left to right. Error bars represent SEM. (B) Normalized ChIP-seq tracks of H3K27ac profiles showing differential enhancer activity of the PI3Kr1, PI3Kr5, and PI3Kr6 loci. Enriched enhancer regions are highlighted in gray and corresponding enriched TF motifs are labeled underneath.

References

    1. Acosta-Alvear D., Zhou Y., Blais A., Tsikitis M., Lents N.H., Arias C., Lennon C.J., Kluger Y., Dynlacht B.D. XBP1 controls diverse cell type- and condition-specific transcriptional regulatory networks. Mol. Cell. 2007;27:53–66. - PubMed
    1. Aguilar C.A., Shcherbina A., Ricke D.O., Pop R., Carrigan C.T., Gifford C.A., Urso M.L., Kottke M.A., Meissner A. In vivo monitoring of transcriptional dynamics after lower-limb muscle injury enables quantitative classification of healing. Sci. Rep. 2015;5:13885. - PMC - PubMed
    1. Almada A.E., Wagers A.J. Molecular circuitry of stem cell fate in skeletal muscle regeneration, ageing and disease. Nat. Rev. Mol. Cell Biol. 2016;17:267–279. - PMC - PubMed
    1. Arnold L., Henry A., Poron F., Baba-Amer Y., van Rooijen N., Plonquet A., Gherardi R.K., Chazaud B. Inflammatory monocytes recruited after skeletal muscle injury switch into anti-inflammatory macrophages to support myogenesis. J. Exp. Med. 2007;204:1057–1069. - PMC - PubMed
    1. Arnold C.P., Tan R., Zhou B., Yue S.B., Schaffert S., Biggs J.R., Doyonnas R., Lo M.C., Perry J.M., Renault V.M. MicroRNA programs in normal and aberrant stem and progenitor cells. Genome Res. 2011;21:798–810. - PMC - PubMed

Publication types