Review
. 2017 Jan:56:107-147.
doi: 10.1016/j.preteyeres.2016.10.001. Epub 2016 Oct 20.

Detection and measurement of clinically meaningful visual field progression in clinical trials for glaucoma

Affiliations
Review

Detection and measurement of clinically meaningful visual field progression in clinical trials for glaucoma

C Gustavo De Moraes et al. Prog Retin Eye Res. 2017 Jan.

Abstract

Glaucomatous visual field progression has both personal and societal costs and therefore has a serious impact on quality of life. At the present time, intraocular pressure (IOP) is considered to be the most important modifiable risk factor for glaucoma onset and progression. Reduction of IOP has been repeatedly demonstrated to be an effective intervention across the spectrum of glaucoma, regardless of subtype or disease stage. In the setting of approval of IOP-lowering therapies, it is expected that effects on IOP will translate into benefits in long-term patient-reported outcomes. Nonetheless, the effect of these medications on IOP and their associated risks can be consistently and objectively measured. This helps to explain why regulatory approval of new therapies in glaucoma has historically used IOP as the outcome variable. Although all approved treatments for glaucoma involve IOP reduction, patients frequently continue to progress despite treatment. It would therefore be beneficial to develop treatments that preserve visual function through mechanisms other than lowering IOP. The United States Food and Drug Administration (FDA) has stated that they will accept a clinically meaningful definition of visual field progression using Glaucoma Change Probability criteria. Nonetheless, these criteria do not take into account the time (and hence, the speed) needed to reach significant change. In this paper we provide an analysis based on the existing literature to support the hypothesis that decreasing the rate of visual field progression by 30% in a trial lasting 12-18 months is clinically meaningful. We demonstrate that a 30% decrease in rate of visual field progression can be reliably projected to have a significant effect on health-related quality of life, as defined by validated instruments designed to measure that endpoint.

Keywords: Clinical trials; Glaucoma; Intraocular pressure; Neuroprotection; Perimetry; Progression.


Figures

Fig. 1
Fig. 1. Estimated prevalence of glaucoma in 2010 based on prevalence model data
Source: Quigley HA, Broman AT. The number of people with glaucoma worldwide in 2010 and 2020. Br J Ophthalmol. Mar 2006;90(3):262–267.
Fig. 2
Fig. 2. Estimated prevalence of glaucoma – 2010 and 2020
Source: Adapted from Quigley HA, Broman AT. The number of people with glaucoma worldwide in 2010 and 2020. Br J Ophthalmol. Mar 2006;90(3):262–267.
Fig. 3
Fig. 3. Cumulative incidence rates for unilateral and bilateral blindness caused by glaucoma
Source: Peters D, Bengtsson B, Heijl A. Lifetime risk of blindness in open-angle glaucoma. Am J Ophthalmol. Oct 2013;156(4):724–730.
Fig. 4
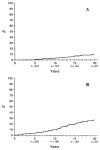
Fig. 4. Kaplan-Meier cumulative probability of glaucoma-related blindness in both eyes (A) and at least one eye (B)
Source: Hattenhauer MG, Johnson DH, Ing HH, et al. The probability of blindness from open-angle glaucoma. Ophthalmology. Nov 1998;105(11):2099–2104.
Fig. 5
Fig. 5. Visual field series from the left and right eyes of a patient demonstrate a linear rate of loss in each eye (dB/year)
Source: Saunders LJ, Russell RA, Kirwan JF, McNaught AI, Crabb DP. Examining visual field loss in patients in glaucoma clinics during their predicted remaining lifetime. Invest Ophthalmol Vis Sci. Jan 2014;55(1):102–109.
Fig. 6
Fig. 6. Distribution of patient eye follow-up times, patient residual life expectancies, and progression rates in all eyes
Source: Saunders LJ, Russell RA, Kirwan JF, McNaught AI, Crabb DP. Examining visual field loss in patients in glaucoma clinics during their predicted remaining lifetime. Invest Ophthalmol Vis Sci. Jan 2014;55(1):102–109.
Fig. 7
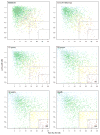
Fig. 7. A series of scatterplots showing MD in left (y-axis) and right (x-axis) eyes at baseline, at the end of follow-up, through extrapolating current rates of MD deterioration, after 10, 20, and 30 years of follow-up and at the end of expected lifetime. Both eyes in the plot had to fulfill the original inclusion criteria. The patients are colored according to their visual disability status at expected time of death. Blue represents a patient where at least one of the eyes has a positive slope over time, green represents progression, but no significant impairment by the end of the patient’s lifetime, yellow represents degradation to visual impairment (−14 dB or worse in both eyes), and red corresponds to statutory blindness in both eyes (below–22 dB). It is worth noting that most of the red symbols are not found in the top left corner of the baseline plot where both eyes are at an early stage of glaucoma
Source: Saunders LJ, Russell RA, Kirwan JF, McNaught AI, Crabb DP. Examining visual field loss in patients in glaucoma clinics during their predicted remaining lifetime. Invest Ophthalmol Vis Sci. Jan 2014;55(1):102–109
Fig. 8
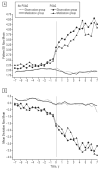
Fig. 8. Effect of timing of intervention on rate of progression
Source: Caprioli J. The importance of rates in glaucoma. Am J Ophthalmol.. Feb 2008;145(2):191–192.
Fig. 9
Fig. 9. Variability in Mean Deviation
Source: Russell RA, Garway-Heath DF, Crabb DP. New insights into measurement variability in glaucomatous visual fields from computer modelling. PloS ONE. 2013;8(12):e83595.
Fig. 10
Fig. 10. Slope of a linear regression of sensitivity against age averaged over all locations in the central and peripheral regions
Source: Gardiner SK, Johnson CA, Spry PG. Normal age-related sensitivity loss for a variety of visual functions throughout the visual field. Optom Vis Sci. Jul 2006;83(7):438–443.
Fig. 11
Fig. 11. Survival plot of the cumulative probability of developing primary open-angle glaucoma (POAG) in the Ocular Hypertension Treatment Study over the entire course of the study (February 1994 to March 2009) by randomized group. The number of participants at risk was those who had not developed POAG at the beginning of each 6-month period. Participants who did not develop POAG and withdrew before the end of the study were censored from their last completed visit. Participants who did not develop POAG and died were censored at their date of death. The shaded column indicates initiation of medication in the original observation group
Source: Kass MA, Gordon MO, Gao F, et al. Delaying treatment of ocular hypertension: the Ocular Hypertension Treatment Study. Arch Ophthalmol. Mar 2010;128(3):276–287.
Fig. 12
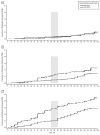
Fig. 12. Survival plot of the cumulative probability of developing primary open-angle glaucoma (POAG) in the Ocular Hypertension Treatment Study during the entire course of the study by randomized group for participants with the lowest tertile (<6.0) (A), middle tertile (6.0%–13%) (B), and highest tertile (>13%) (C) of baseline predicted 5-year risk of POAG. Participants who did not develop POAG and withdrew before the end of the study were censored from the interval of their last completed visit. Participants who did not develop POAG and died were censored at their date of death. The shaded column indicates initiation of medication in the original observation group
Source: Kass MA, Gordon MO, Gao F, et al. Delaying treatment of ocular hypertension: the Ocular Hypertension Treatment Study. Arch Ophthalmol. Mar 2010;128(3):276–287.
Fig. 13
Fig. 13. Survival plot of the cumulative probability of developing primary open-angle glaucoma (POAG) in the Ocular Hypertension Treatment Study during the entire course of the study by randomized group for participants with the lowest tertile (<6.0) (A), middle tertile (6.0%–13%) (B), and highest tertile (>13%) (C) of baseline predicted 5-year risk of POAG. Participants who did not develop POAG and withdrew before the end of the study were censored from the interval of their last completed visit. Participants who did not develop POAG and died were censored at their date of death. The shaded column indicates initiation of medication in the original observation group
Source: Kass MA, Gordon MO, Gao F, et al. Delaying treatment of ocular hypertension: the Ocular Hypertension Treatment Study. Arch Ophthalmol. Mar 2010;128(3):276–287.
Fig. 14
Fig. 14. Low-pressure Glaucoma Treatment Study: Comparison of mean deviation (MD) rates of change (dB/yr) between progressing (light gray) and nonprogressing (dark grey) eyes based on the pointwise linear regression criteria. The black curve corresponds to Gaussian curves based on the estimates from study patients
Source: De Moraes CG, Liebmann JM, Greenfield DS, Gardiner SK, Ritch R, Krupin T. Risk factors for visual field progression in the Low-Pressure Glaucoma Treatment Study. Am J Ophthalmol. Oct 2012;154(4):702–711.
Fig. 15
Fig. 15
PROGRESSOR output. Top: summary statistics depicting the global rate of progression, the number of progressing visual field points, and their average rate of progression. Bottom: Visual field representation showing the location of progressing points. Note that while the left eye progressed significantly, the right eye was more stable.
Fig. 16
Fig. 16. Survival curves showing time to progression for the three sets of criteria (EMGT, AGIS, CIGTS studies)
Source: Heijl A, Bengtsson B, Chauhan BC, et al. A comparison of visual field progression criteria of 3 major glaucoma trials in early manifest glaucoma trial patients. Ophthalmology. Sep 2008;115(9):1557–1565.
Fig. 17
Fig. 17. Statistical power to detect various rates of MD change (expressed as a multiple of the SD) for given numbers of examinations
Source: Chauhan BC, Garway-Heath DF, Goni FJ, et al. Practical recommendations for measuring rates of visual field change in glaucoma. Br J Ophthalmol. Apr 2008;92(4):569–573.
Fig. 18
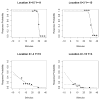
Fig. 18. Response probabilities for a sample study subject at 4 tested locations (at positions as labeled in degrees). The dashed line indicates the frequency-of-seeing (FOS) curve as fitted using the primary analysis, in which the maximum response probability would be 95% if contrast could be made sufficiently high (assuming a 5% false-negative rate). The dotted line indicates the FOS curve fit
Source: Gardiner SK, Swanson WH, Goren D, Mansberger SL, Demirel S. Assessment of the Reliability of Standard Automated Perimetry in Regions of Glaucomatous Damage. Ophthalmology. 2014 Jul;121(7):1359–69.
Fig. 19
Fig. 19. Analysis of the relationship between visual field parameters and estimated RGC counts. (A) Relationship between MD and estimated RGC counts. (B) First derivatives of the curve shown on A plotted against estimated RGC counts. The derivatives indicate the amount of change in MD per 10,000 RGCs at different levels of RGC counts
Source: Medeiros FA, Zangwill LM, Bowd C, Mansouri K, Weinreb RN. The structure and function relationship in glaucoma: implications for detection of progression and measurement of rates of change. Invest Ophthalmol Vis Sci. Oct 2012;53(11):6939–6946.
Fig. 20
Fig. 20
Relationship between baseline visual field damage and rates of progression using linear (1/Lambert) and non-linear (dB) scales.
Fig. 21
Fig. 21. Modeled probability of not driving as a function of better-eye visual field loss in glaucoma patients. In addition to better-eye mean deviation, the multivariable logistic regression model includes age, gender, unemployment, cognition, comorbidities, and depressive symptoms
Source: van Landingham SW, Hochberg C, Massof RW, Chan E, Friedman DS, Ramulu PY. Driving patterns in older adults with glaucoma. BMC Ophthalmol. 2013;13:4.
Fig. 22
Fig. 22. Fear of falling levels by severity of visual field loss. Lower fear of falling scores indicate greater fear of falling, evidenced by fear with easier tasks. The relationship between fear of falling scores and better-eye mean deviation is plotted as a linear relationship using bivariate regression
Source: Ramulu PY, van Landingham SW, Massof RW, Chan ES, Ferrucci L, Friedman DS. Fear of falling and visual field loss from glaucoma. Ophthalmology. Jul 2012;119(7):1352–1358.
Fig. 23
Fig. 23. Financial burden of glaucoma with disease severity
Source: Rein DB, Wittenborn JS, Lee PP, et al. The cost-effectiveness of routine office-based identification and subsequent medical treatment of primary open-angle glaucoma in the United States. Ophthalmology. May 2009;116(5):823–832.
Fig. 24
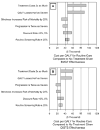
Fig. 24. Sensitivity of cost-effectiveness ratio to changes in major model parameters. The cost-effectiveness of routine diagnosis and subsequent treatment compared with no treatment given (A) the efficacy seen in the EMGT and (B) the efficacy seen in the CIGTS. CIGTS = Collaborative Initial Glaucoma Treatment Study; EMGT = Early Manifest Glaucoma Trial; QALY = quality adjusted life year
Source: Rein DB, Wittenborn JS, Lee PP, et al. The cost-effectiveness of routine office-based identification and subsequent medical treatment of primary open-angle glaucoma in the United States. Ophthalmology. May 2009;116(5):823–832.

References

    1. AAO. Preferred Practice Pattern® Guidelines. Primary Open-Angle Glaucoma. American Academy of Ophthalmology; San Francisco, CA: 2010.
    1. Adams CW, Bullimore MA, Wall M, Fingeret M, Johnson CA. Normal aging effects for frequency doubling technology perimetry. Optom Vis Sci off Publ Am Acad Optom. 1999;76:582–587. - PubMed
    1. Administration, U.S.S. Disability evaluation under Social Security.
    1. AGIS. The advanced glaucoma intervention study (AGIS): 7. The relationship between control of intraocular pressure and visual field deterioration. Am J Ophthalmol. 2000;130:429–440. - PubMed
    1. AGIS. The advanced glaucoma intervention study (AGIS): 12. Baseline risk factors for sustained loss of visual field and visual acuity in patients with advanced glaucoma. Am J Ophthalmol. 2002;134:499–512. - PubMed

Publication types

Substances