Clinical Trial
. 2017 Jun;139(6):1830-1839.e13.
doi: 10.1016/j.jaci.2016.09.024. Epub 2016 Oct 20.

Intradermal grass pollen immunotherapy increases TH2 and IgE responses and worsens respiratory allergic symptoms

Affiliations
Clinical Trial

Intradermal grass pollen immunotherapy increases TH2 and IgE responses and worsens respiratory allergic symptoms

Anna Slovick et al. J Allergy Clin Immunol. 2017 Jun.

Abstract

Background: Repeated low-dose grass pollen intradermal allergen injection suppresses allergen-induced cutaneous late-phase responses comparably with conventional subcutaneous and sublingual immunotherapy.

Objective: We sought to evaluate the efficacy and safety of grass pollen intradermal immunotherapy in the treatment of allergic rhinitis.

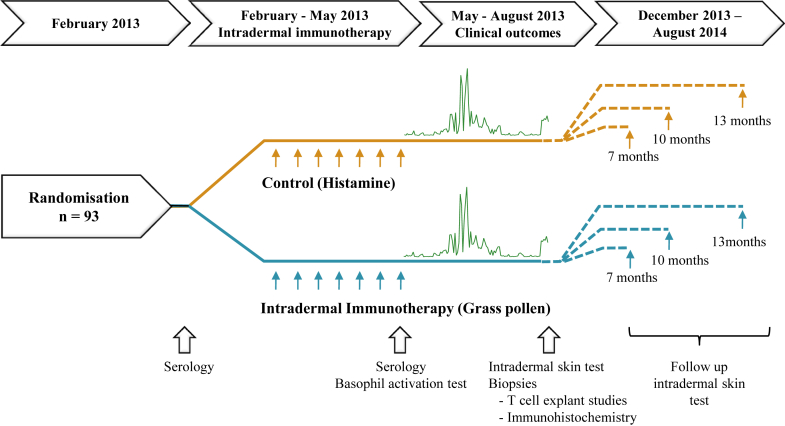
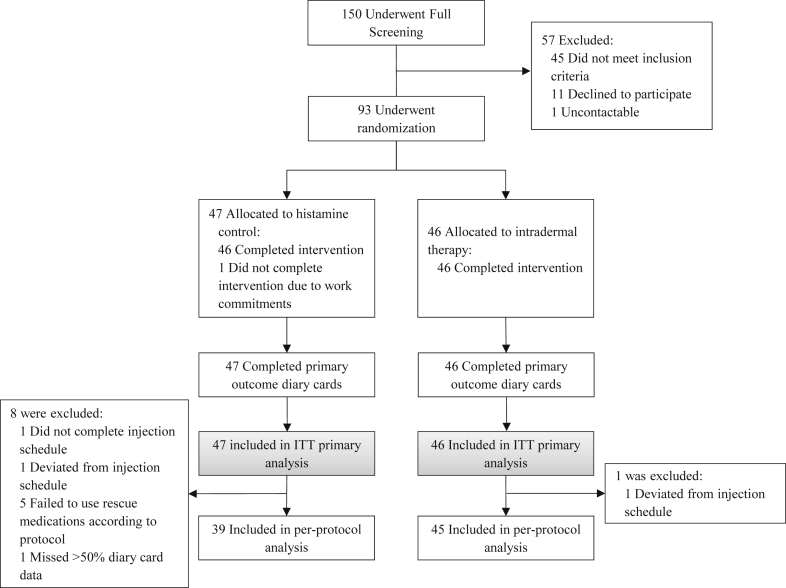
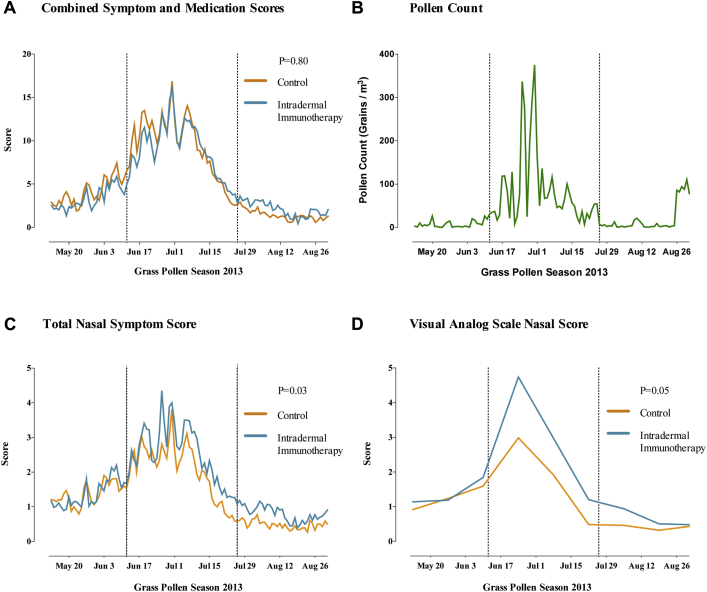
Methods: We randomly assigned 93 adults with grass pollen-induced allergic rhinitis to receive 7 preseasonal intradermal allergen injections (containing 7 ng of Phl p 5 major allergen) or a histamine control. The primary end point was daily combined symptom-medication scores during the 2013 pollen season (area under the curve). Analysis was by intention to treat. Skin biopsy specimens were collected after intradermal allergen challenges, and late-phase responses were measured 4 and 7, 10, or 13 months after treatment.

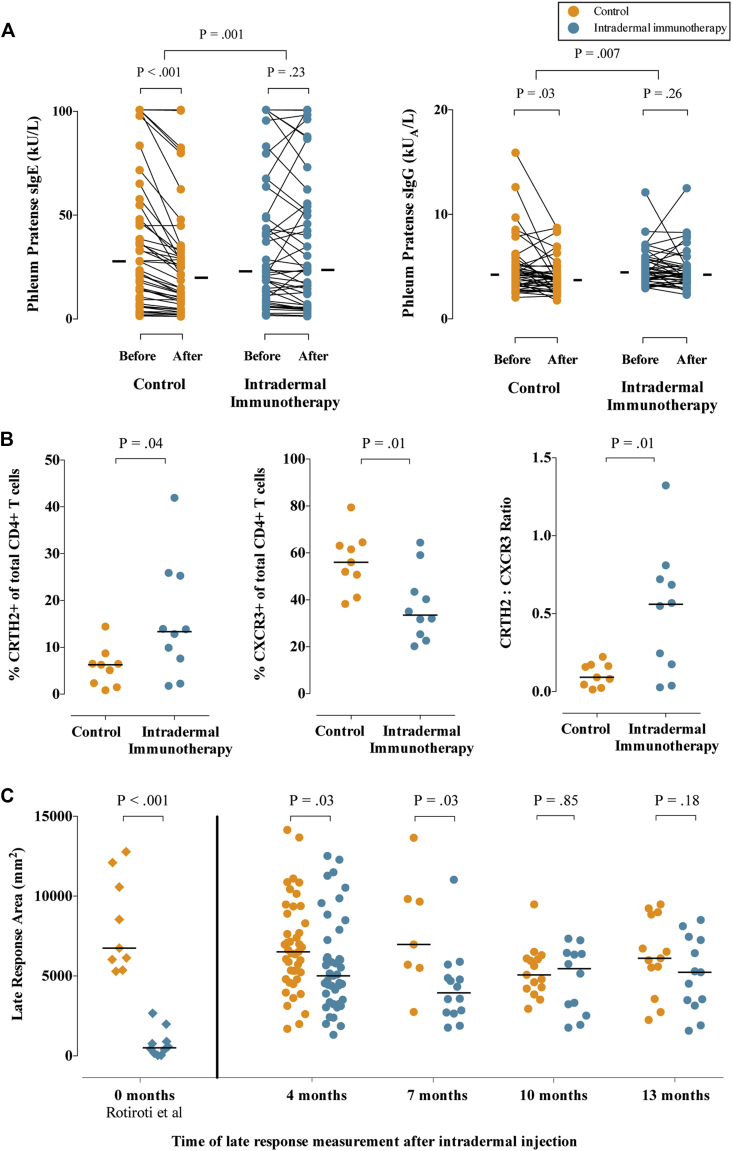
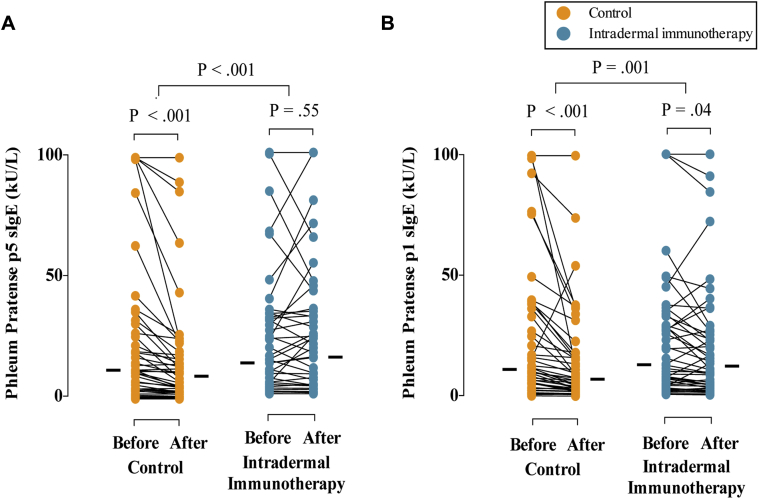
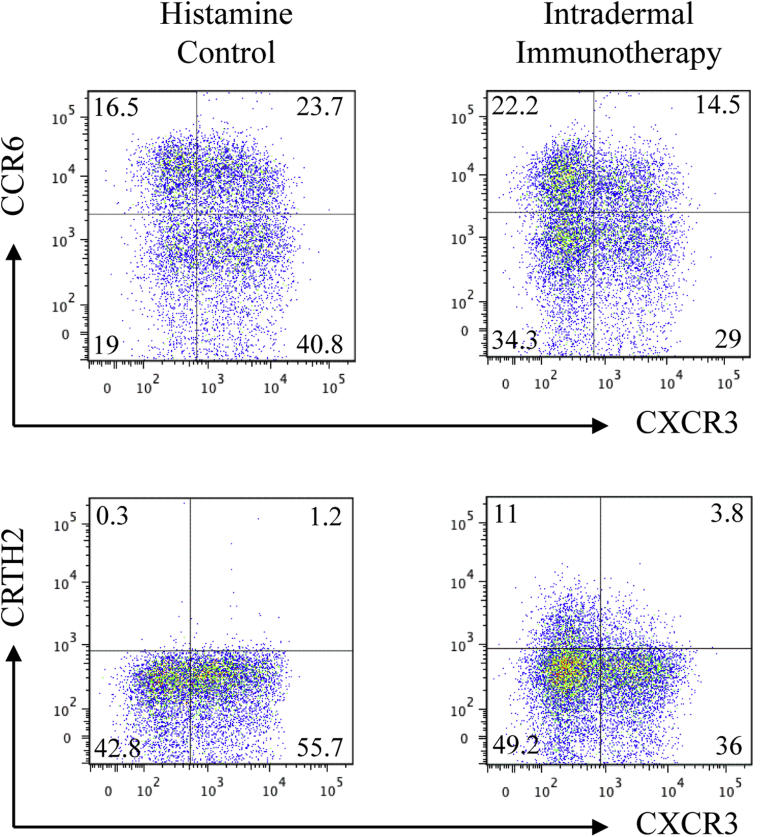
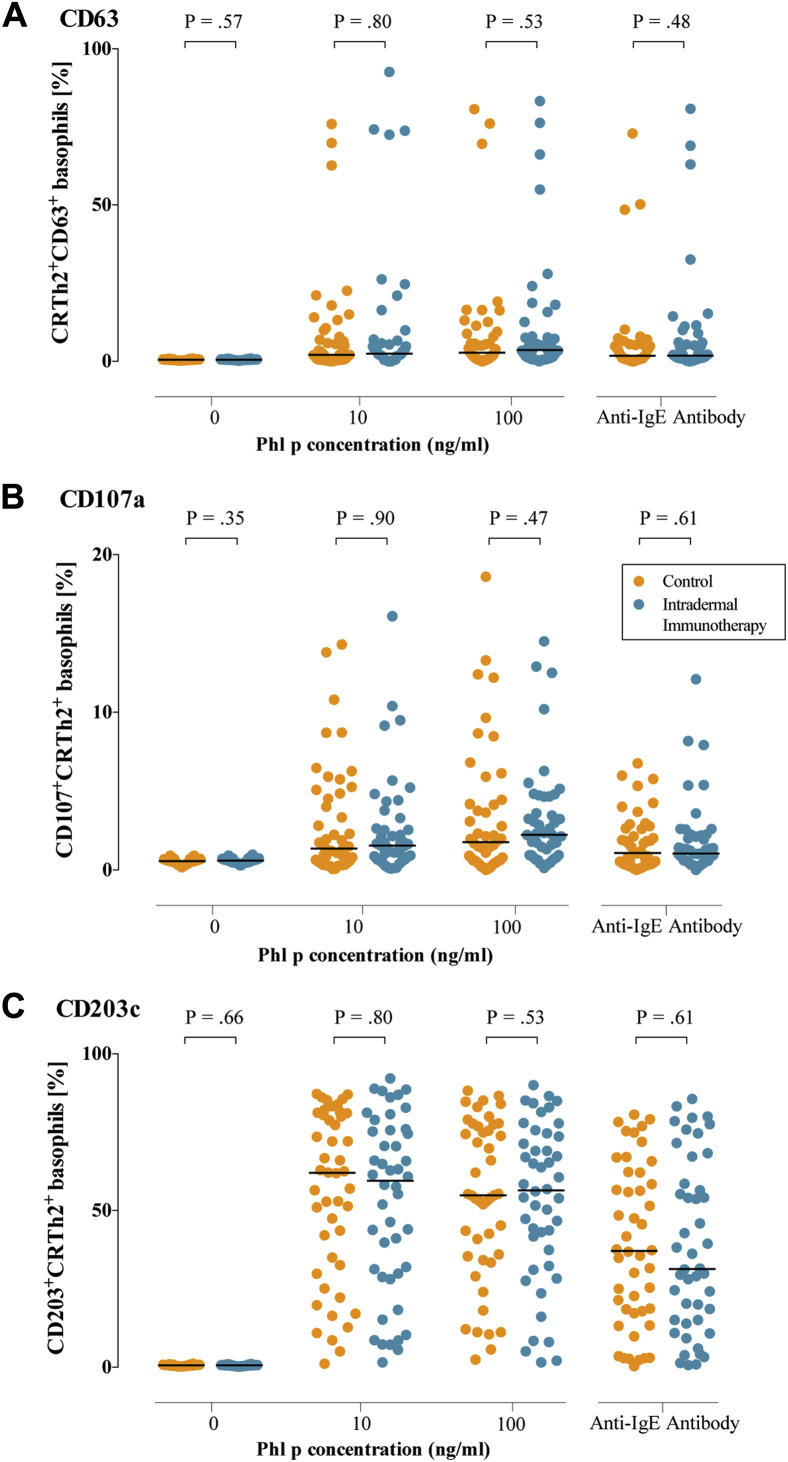
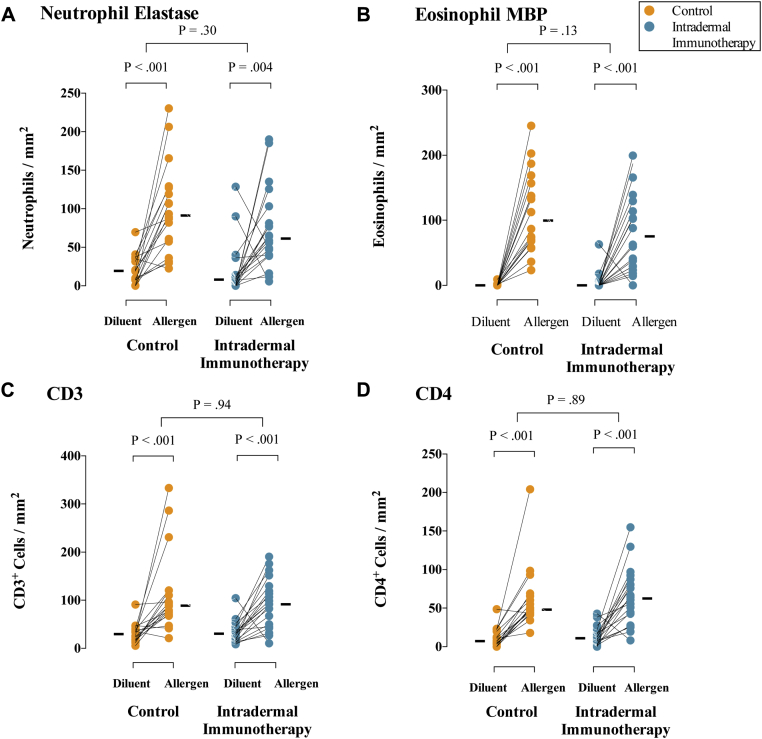
Results: There was no significant difference in the primary end point between treatment arms (active, n = 46; control, n = 47; median difference, 14; 95% CI, -172.5 to 215.1; P = .80). Among secondary end points, nasal symptoms were worse in the intradermal treatment group, as measured based on daily (median difference, 35; 95% CI, 4.0-67.5; P = .03) and visual analog scale (median difference, 53; 95% CI, -11.6 to 125.2; P = .05) scores. In a per-protocol analysis intradermal immunotherapy was further associated with worse asthma symptoms and fewer symptom-free days. Intradermal immunotherapy increased serum Phleum pratense-specific IgE levels (P = .001) compared with those in the control arm. T cells cultured from biopsy specimens of subjects undergoing intradermal immunotherapy had higher expression of the TH2 surface marker CRTH2 (P = .04) and lower expression of the TH1 marker CXCR3 (P = .01), respectively. Late-phase responses remained inhibited 7 months after treatment (P = .03).

Conclusion: Intradermal allergen immunotherapy suppressed skin late-phase responses but was not clinically effective and resulted in worsening of respiratory allergic symptoms.

Keywords: Allergy immunotherapy; Phleum pratense; allergic rhinitis; grass pollen; immunotherapy; intradermal; low dose.


Figures

Fig 1
Fig 1
Study design.
Fig 2
Fig 2
CONSORT diagram. All randomized participants were included in the intention-to-treat (ITT) analysis. Only participants who adequately adhered to treatment and rescue medications were included in the per-protocol analysis.
Fig 3
Fig 3
Primary outcome and nasal symptoms. A, Mean daily combined symptom and medication scores in the primary intention-to-treat analysis. Broken vertical lines indicate the beginning and end of the peak pollen season (June 12 to July 26, 2013). B, Daily grass pollen counts in central London during the 2013 grass pollen season. C, Mean daily nasal symptom scores (sum of scores for sneezing, blockage, and running). D, Mean nasal symptoms measured by using a VAS (total of blockage, running, itching, and sneezing). AUC values for each participant were compared according to treatment arm. P values are based on the Mann-Whitney U test.
Fig 4
Fig 4
Immunologic outcomes. A, Levels of P pratense–specific IgE and IgG before and after completion of 7 intradermal allergen or histamine control injections. B, Expression of CRTH2 (TH2 marker) and CXCR3 (TH1 marker) on CD4+ cells expanded from skin biopsy specimens (24 hours after skin challenge). C, Areas of cutaneous late-phase responses (24 hours after intradermal skin challenge) 4 months and either 7, 10, or 13 months after treatment (September 2013). Late-phase response suppression was shown in our previous study (Rotiroti et al5) immediately after 6 biweekly intradermal injections. Solid bars represent median values. P values for pretreatment and posttreatment serology comparisons are based on the Wilcoxon signed-rank test, and those for between-group IgE and IgG levels are based on analysis of covariance. P values in Fig 4, B and C, are based on the Mann-Whitney U test.
Fig E1
Fig E1
Effects of intradermal immunotherapy on Phl p 5– (A) and Phl p 1– (B) specific IgE. Levels of IgE specific for the major allergens Phl p 5 and Phl p 1 before and after completion of 7 intradermal allergen or histamine control injections are shown. P values for pretreatment and posttreatment comparisons were based on the Wilcoxon signed-rank test. P values for between-group comparisons were based on analysis of covariance.
Fig E2
Fig E2
Flow cytometric analysis of CD4+ T cells from skin biopsy explants. Representative flow cytometric plots illustrating surface staining for CCR6, CXCR3, and CRTH2 gated on skin biopsy-derived CD4+ T cells in a participant who received histamine control (left) and a participant who received grass pollen intradermal injections (right) are shown.
Fig E3
Fig E3
Heat map showing expression of selected genes associated with TH1/TH2 phenotypes and allergic inflammatory responses.
Fig E4
Fig E4
Basophil activation tests. Percentages of basophils staining positive for the activation markers CD63 (A), CD107a (B), and CD203c (C) are shown. Whole blood was stimulated under the conditions shown. P values are based on the Mann-Whitney U test.
Fig E5
Fig E5
Immunohistochemistry analysis of skin biopsy specimens. Comparison of allergen-induced inflammatory cell numbers in skin biopsy specimens from intradermal immunotherapy and control arm participants. Data shown indicate numbers of neutrophils (A), eosinophils (B), CD3+ cells (C), and CD4+ cells (D) in skin biopsy specimens taken after diluent and P Pratense intradermal skin challenges in September 2013. Cells were stained by using the APAAP method. Solid bars represent median values. P values comparing diluent- and allergen-challenged biopsy specimens are based on the Wilcoxon signed-rank test. P values for between-group comparisons are based on analysis of covariance.
Fig E6
Fig E6
Lymphangitis in a participant who received active intradermal immunotherapy. The photograph was taken 40 minutes after intradermal injection.

References

    1. Calderon M., Alves B., Jacobson M., Hurwitz B., Sheikh A., Durham S. Allergen injection immunotherapy for seasonal allergic rhinitis. Cochrane Database Syst Rev. 2007;(1):CD001936. - PMC - PubMed
    1. Radulovic S., Calderon M.A., Wilson D., Durham S. Sublingual immunotherapy for allergic rhinitis. Cochrane Database Syst Rev. 2010;(12):CD002893. - PMC - PubMed
    1. Kiel M.A., Roder E., Gerth van Wijk R., Al M.J., Hop W.C., Rutten-van Molken M.P. Real-life compliance and persistence among users of subcutaneous and sublingual allergen immunotherapy. J Allergy Clin Immunol. 2013;132:353–360.e2. - PubMed
    1. Kay A.B., Ying S., Varney V., Gaga M., Durham S.R., Moqbel R. Messenger RNA expression of the cytokine gene cluster, interleukin 3 (IL-3), IL-4, IL-5, and granulocyte/macrophage colony-stimulating factor, in allergen-induced late-phase cutaneous reactions in atopic subjects. J Exp Med. 1991;173:775–778. - PMC - PubMed
    1. Rotiroti G., Shamji M., Durham S.R., Till S.J. Repeated low-dose intradermal allergen injection suppresses allergen-induced cutaneous late responses. J Allergy Clin Immunol. 2012;130:918–924.e1. - PubMed

Publication types

MeSH terms