

How Genes Modulate Patterns of Aging-Related Changes on the Way to 100: Biodemographic Models and Methods in Genetic Analyses of Longitudinal Data
- PMID: 27773987
- PMCID: PMC5070546
- DOI: 10.1080/10920277.2016.1178588
How Genes Modulate Patterns of Aging-Related Changes on the Way to 100: Biodemographic Models and Methods in Genetic Analyses of Longitudinal Data
Abstract
Background and objective: To clarify mechanisms of genetic regulation of human aging and longevity traits, a number of genome-wide association studies (GWAS) of these traits have been performed. However, the results of these analyses did not meet expectations of the researchers. Most detected genetic associations have not reached a genome-wide level of statistical significance, and suffered from the lack of replication in the studies of independent populations. The reasons for slow progress in this research area include low efficiency of statistical methods used in data analyses, genetic heterogeneity of aging and longevity related traits, possibility of pleiotropic (e.g., age dependent) effects of genetic variants on such traits, underestimation of the effects of (i) mortality selection in genetically heterogeneous cohorts, (ii) external factors and differences in genetic backgrounds of individuals in the populations under study, the weakness of conceptual biological framework that does not fully account for above mentioned factors. One more limitation of conducted studies is that they did not fully realize the potential of longitudinal data that allow for evaluating how genetic influences on life span are mediated by physiological variables and other biomarkers during the life course. The objective of this paper is to address these issues.
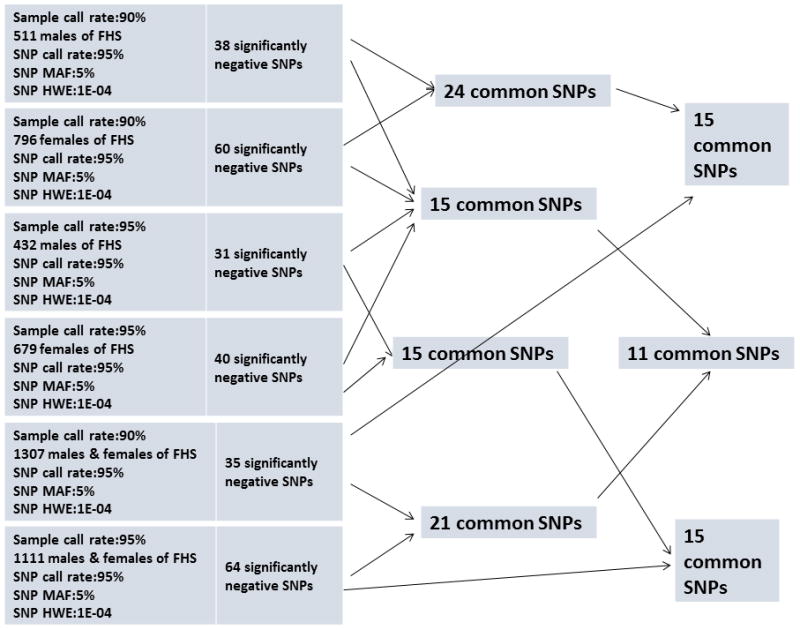
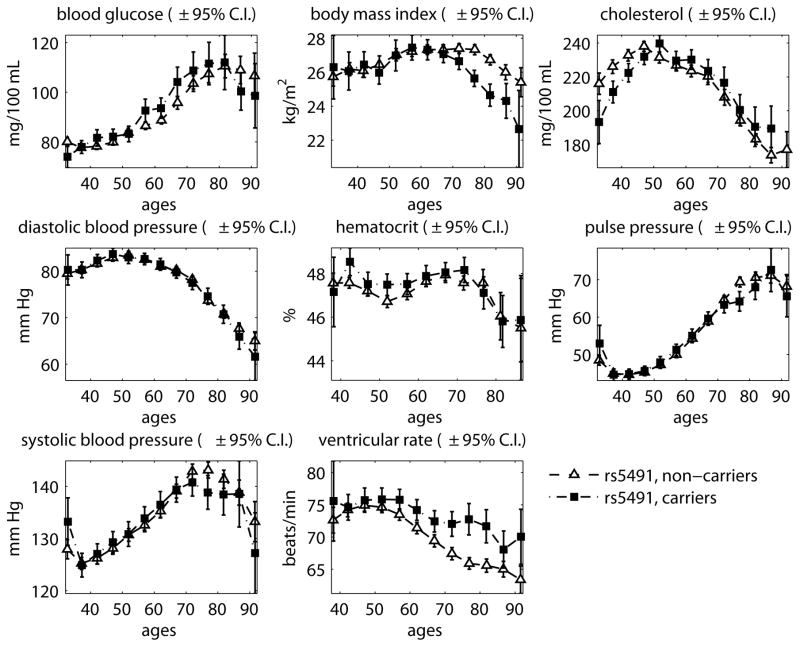
Data and methods: We performed GWAS of human life span using different subsets of data from the original Framingham Heart Study cohort corresponding to different quality control (QC) procedures and used one subset of selected genetic variants for further analyses. We used simulation study to show that approach to combining data improves the quality of GWAS. We used FHS longitudinal data to compare average age trajectories of physiological variables in carriers and non-carriers of selected genetic variants. We used stochastic process model of human mortality and aging to investigate genetic influence on hidden biomarkers of aging and on dynamic interaction between aging and longevity. We investigated properties of genes related to selected variants and their roles in signaling and metabolic pathways.
Results: We showed that the use of different QC procedures results in different sets of genetic variants associated with life span. We selected 24 genetic variants negatively associated with life span. We showed that the joint analyses of genetic data at the time of bio-specimen collection and follow up data substantially improved significance of associations of selected 24 SNPs with life span. We also showed that aging related changes in physiological variables and in hidden biomarkers of aging differ for the groups of carriers and non-carriers of selected variants.
Conclusions: . The results of these analyses demonstrated benefits of using biodemographic models and methods in genetic association studies of these traits. Our findings showed that the absence of a large number of genetic variants with deleterious effects may make substantial contribution to exceptional longevity. These effects are dynamically mediated by a number of physiological variables and hidden biomarkers of aging. The results of these research demonstrated benefits of using integrative statistical models of mortality risks in genetic studies of human aging and longevity.
Keywords: genetic model of mortality; genetics of aging; genetics of longevity; physiological variables; stress resistance.
Figures


Similar articles
-
Genetics of aging, health, and survival: dynamic regulation of human longevity related traits.Front Genet. 2015 Apr 13;6:122. doi: 10.3389/fgene.2015.00122. eCollection 2015. Front Genet. 2015. PMID: 25918517 Free PMC article.
-
How genes influence life span: the biodemography of human survival.Rejuvenation Res. 2012 Aug;15(4):374-80. doi: 10.1089/rej.2011.1290. Epub 2012 May 18. Rejuvenation Res. 2012. PMID: 22607627 Free PMC article.
-
Genetic variation and human longevity.Dan Med J. 2012 May;59(5):B4454. Dan Med J. 2012. PMID: 22549493
-
Folic acid supplementation and malaria susceptibility and severity among people taking antifolate antimalarial drugs in endemic areas.Cochrane Database Syst Rev. 2022 Feb 1;2(2022):CD014217. doi: 10.1002/14651858.CD014217. Cochrane Database Syst Rev. 2022. PMID: 36321557 Free PMC article.
-
How the effects of aging and stresses of life are integrated in mortality rates: insights for genetic studies of human health and longevity.Biogerontology. 2016 Feb;17(1):89-107. doi: 10.1007/s10522-015-9594-8. Epub 2015 Aug 18. Biogerontology. 2016. PMID: 26280653 Free PMC article. Review.
Cited by
-
Arterial and Cardiac Remodeling Associated With Extra Weight Gain in an Isolated Abdominal Obesity Cohort.Front Cardiovasc Med. 2021 Nov 5;8:771022. doi: 10.3389/fcvm.2021.771022. eCollection 2021. Front Cardiovasc Med. 2021. PMID: 34805324 Free PMC article.
-
Quantifying the Potential for Future Gene Therapy to Lower Lifetime Risk of Polygenic Late-Onset Diseases.Int J Mol Sci. 2019 Jul 8;20(13):3352. doi: 10.3390/ijms20133352. Int J Mol Sci. 2019. PMID: 31288412 Free PMC article.
-
How lifespan associated genes modulate aging changes: lessons from analysis of longitudinal data.Front Genet. 2013 Jan 22;4:3. doi: 10.3389/fgene.2013.00003. eCollection 2013. Front Genet. 2013. PMID: 23346098 Free PMC article.
-
Functional aging in health and heart failure: the COmPLETE Study.BMC Cardiovasc Disord. 2019 Jul 30;19(1):180. doi: 10.1186/s12872-019-1164-6. BMC Cardiovasc Disord. 2019. PMID: 31362698 Free PMC article.
-
Optimal Versus Realized Trajectories of Physiological Dysregulation in Aging and Their Relation to Sex-Specific Mortality Risk.Front Public Health. 2016 Jan 25;4:3. doi: 10.3389/fpubh.2016.00003. eCollection 2016. Front Public Health. 2016. PMID: 26835445 Free PMC article.
References
-
- Abraham RT. GOLPH3 links the Golgi network to mTOR signaling and human cancer. Pigment Cell Melanoma Res. 2009;22(4):378–379. - PubMed
-
- Albin RL. Antagonistic pleiotropy, mutation accumulation, and human genetic disease. Genetica. 1993;91(1–3):279–286. - PubMed
-
- Allison DB, Faith MS, Heo M, Kotler DP. Hypothesis concerning the U-shaped relation between body mass index and mortality. American Journal of Epidemiology. 1997;146(4):339–349. - PubMed
Grants and funding
LinkOut - more resources
Full Text Sources
Other Literature Sources