

Causal diagrams, information bias, and thought bias
- PMID: 27774007
- PMCID: PMC5045000
- DOI: 10.2147/POR.S13335
Causal diagrams, information bias, and thought bias
Abstract
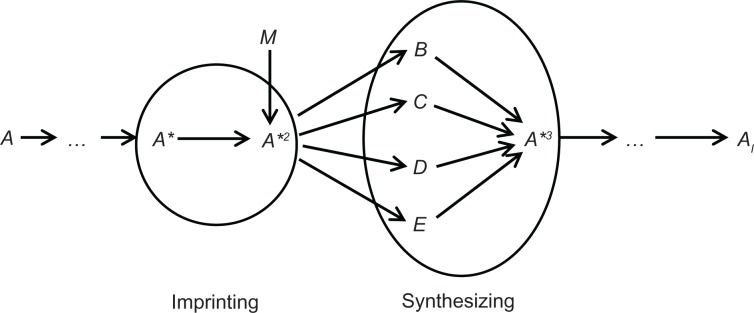
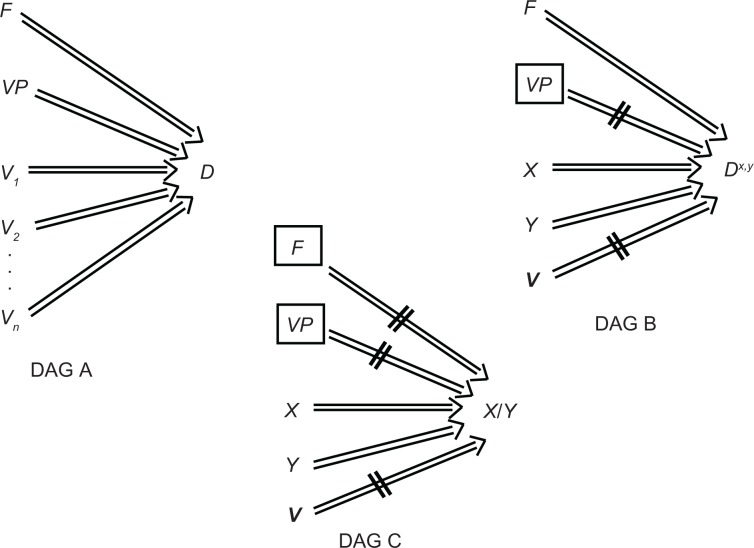
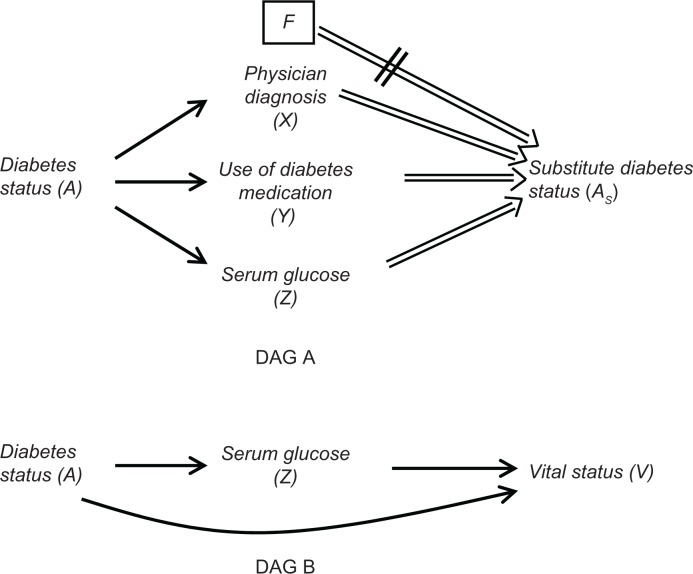
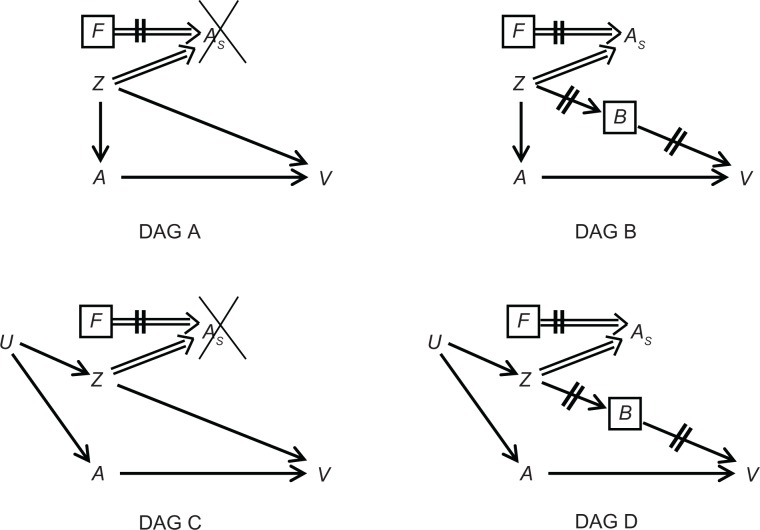
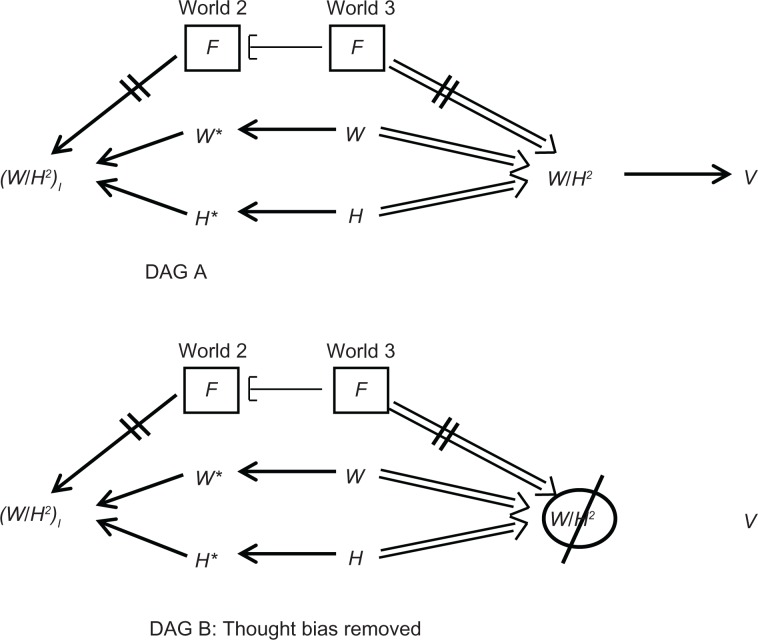
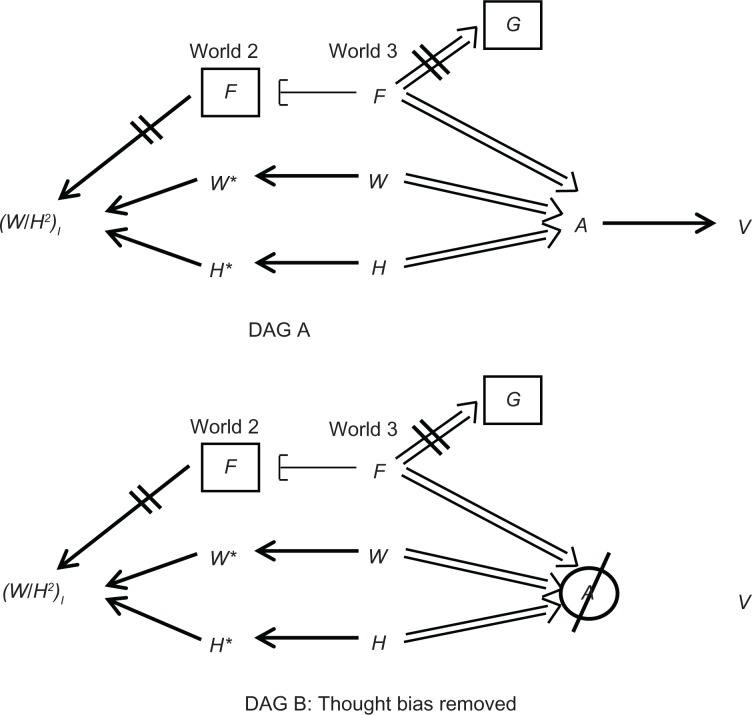
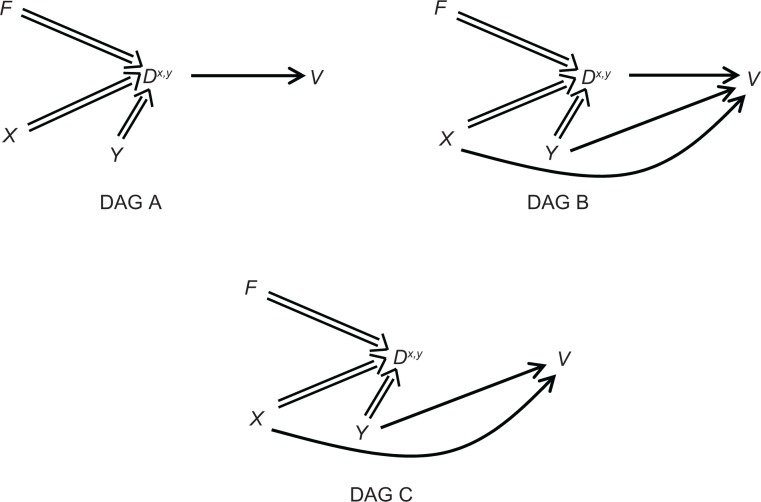
Information bias might be present in any study, including randomized trials, because the values of variables of interest are unknown, and researchers have to rely on substitute variables, the values of which provide information on the unknown true values. We used causal directed acyclic graphs to extend previous work on information bias. First, we show that measurement is a complex causal process that has two components, ie, imprinting and synthesizing. Second, we explain how the unknown values of a variable may be imputed from other variables, and present examples of valid and invalid substitutions for a variable of interest. Finally, and most importantly, we describe a previously unrecognized bias, which may be viewed as antithetical to information bias. This bias arises whenever a variable does not exist in the physical world, yet researchers obtain "information" on its nonexistent values and estimate nonexistent causal parameters. According to our thesis, the scientific literature contains many articles that are affected by such bias.
Keywords: causal diagrams; derived variables; directed acyclic graphs; imputation; information bias; thought bias.
Figures
References
-
- Pearl J. Causal diagrams for empirical research. Biometrika. 1995;82(4):669–688.
-
- Hernán MA, Robins JM. A structural approach to observation bias. Am J Epidemiol. 2005;161(Suppl):S100.
-
- Shahar E. Causal diagrams for encoding and evaluation of information bias. J Eval Clin Pract. 2009;15(3):436–440. - PubMed
-
- Shahar E. The association of body mass index with health outcomes: Causal, inconsistent, or confounded? Am J Epidemiol. 2009;170(8):957–958. rejoinder 963–964. - PubMed
LinkOut - more resources
Full Text Sources
