

More reliable inference for the dissimilarity index of segregation
- PMID: 27774035
- PMCID: PMC5054828
- DOI: 10.1111/ectj.12039
More reliable inference for the dissimilarity index of segregation
Abstract
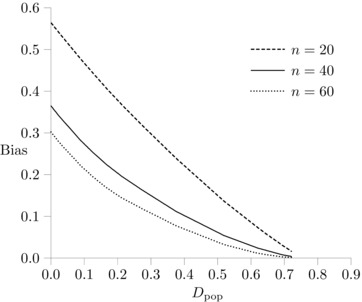
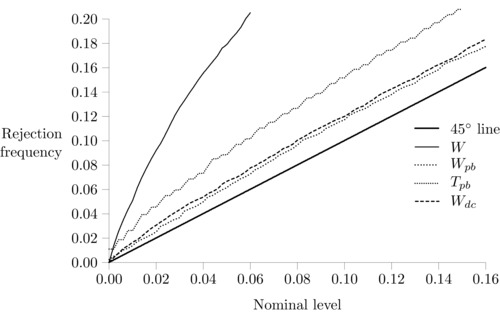
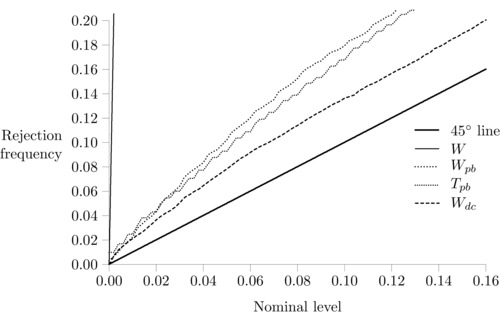
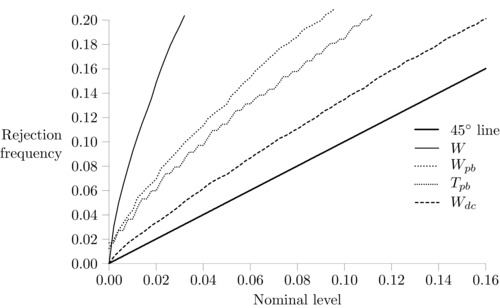
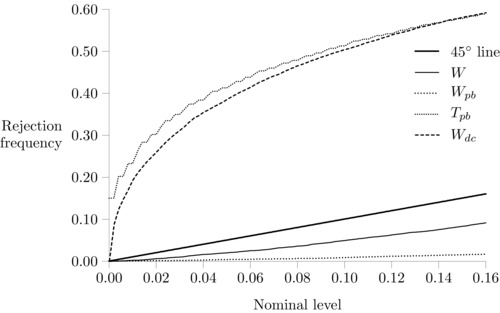
The most widely used measure of segregation is the so-called dissimilarity index. It is now well understood that this measure also reflects randomness in the allocation of individuals to units (i.e. it measures deviations from evenness, not deviations from randomness). This leads to potentially large values of the segregation index when unit sizes and/or minority proportions are small, even if there is no underlying systematic segregation. Our response to this is to produce adjustments to the index, based on an underlying statistical model. We specify the assignment problem in a very general way, with differences in conditional assignment probabilities underlying the resulting segregation. From this, we derive a likelihood ratio test for the presence of any systematic segregation, and bias adjustments to the dissimilarity index. We further develop the asymptotic distribution theory for testing hypotheses concerning the magnitude of the segregation index and show that the use of bootstrap methods can improve the size and power properties of test procedures considerably. We illustrate these methods by comparing dissimilarity indices across school districts in England to measure social segregation.
Keywords: Bootstrap methods; Dissimilarity index; Hypothesis testing; Segregation.
Figures
References
-
- Allen, R. and Vignoles A. (2008). What should an index of school segregation measure? Oxford Review of Education 33, 643–68.
-
- Boisso, D. , Hayes K., Hirschberg J. and Silber J. (1994). Occupational segregation in the multidimensional case. Journal of Econometrics 61, 161–71.
-
- Burgess, S. , McConnell B., Propper C. and Wilson D. (2006). The impact of school choice on sorting by ability and socio‐economic factors in english secondary education In Woessmann L. and Peterson P. (Eds.), Schools and the Equal Opportunity Problem, 273–292. Cambridge, MA: MIT Press.
-
- Carrington, W. J. and Troske K. R. (1997). On measuring segregation in samples with small units. Journal of Business and Economic Statistics 15, 402–09.
-
- Cortese, C. F. , Falk R. F. and Cohen J. K. (1976). Further considerations on the methodological analysis of segregation indices. American Sociological Review 41, 630–37.
LinkOut - more resources
Full Text Sources
Other Literature Sources