. 2016 Oct 7:10:78.
doi: 10.3389/fncir.2016.00078. eCollection 2016.

TMSEEG: A MATLAB-Based Graphical User Interface for Processing Electrophysiological Signals during Transcranial Magnetic Stimulation

Affiliations

TMSEEG: A MATLAB-Based Graphical User Interface for Processing Electrophysiological Signals during Transcranial Magnetic Stimulation

Sravya Atluri et al. Front Neural Circuits. .

Abstract

Concurrent recording of electroencephalography (EEG) during transcranial magnetic stimulation (TMS) is an emerging and powerful tool for studying brain health and function. Despite a growing interest in adaptation of TMS-EEG across neuroscience disciplines, its widespread utility is limited by signal processing challenges. These challenges arise due to the nature of TMS and the sensitivity of EEG to artifacts that often mask TMS-evoked potentials (TEP)s. With an increase in the complexity of data processing methods and a growing interest in multi-site data integration, analysis of TMS-EEG data requires the development of a standardized method to recover TEPs from various sources of artifacts. This article introduces TMSEEG, an open-source MATLAB application comprised of multiple algorithms organized to facilitate a step-by-step procedure for TMS-EEG signal processing. Using a modular design and interactive graphical user interface (GUI), this toolbox aims to streamline TMS-EEG signal processing for both novice and experienced users. Specifically, TMSEEG provides: (i) targeted removal of TMS-induced and general EEG artifacts; (ii) a step-by-step modular workflow with flexibility to modify existing algorithms and add customized algorithms; (iii) a comprehensive display and quantification of artifacts; (iv) quality control check points with visual feedback of TEPs throughout the data processing workflow; and (v) capability to label and store a database of artifacts. In addition to these features, the software architecture of TMSEEG ensures minimal user effort in initial setup and configuration of parameters for each processing step. This is partly accomplished through a close integration with EEGLAB, a widely used open-source toolbox for EEG signal processing. In this article, we introduce TMSEEG, validate its features and demonstrate its application in extracting TEPs across several single- and multi-pulse TMS protocols. As the first open-source GUI-based pipeline for TMS-EEG signal processing, this toolbox intends to promote the widespread utility and standardization of an emerging technology in brain research.

Keywords: MATLAB toolbox; artifact correction; brain mapping; electroencephalography; independent component analysis; signal processing; standardized workflow; transcranial magnetic stimulation.


Figures

Figure 1
Figure 1
Examples of common artifacts in transcranial magnetic stimulation-electroencephalography (TMS-EEG) data. In each panel, the x-axis represents time in the millisecond range and y-axis represents the amplitude of the EEG signal in the microvolt range. Topographical maps in each panel illustrate the scalp projection of each corresponding artifact. The displayed artifacts are: (A) the large-amplitude TMS pulse artifact (red) with the associated TMS decay artifact (green), (B) recharging artifact, (C) TMS-evoked eye blink artifact and (D) TMS-related muscle artifact.
Figure 2
Figure 2
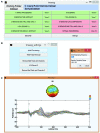
TMSEEG main graphical user interface (GUI). (A) TMSEEG main GUI window comprised of a button for TMS-EEG file selection, 10 data processing buttons, 10 data View buttons, and two buttons for access to the Settings menu and EEGLAB toolbox. Data processing buttons are coded in red if a step is yet to be processed and changed to green at the completion of a step. (B) Users can change the default settings of any processing step in the corresponding Settings window. (C) Selecting the “View #” button next to a processing step will display the average butterfly plot illustrating TMS-evoked potentials (TEP)s at the completion of that step for a quality control check. X-axes represent time in milliseconds relative to presentation of TMS pulse and y-axes represent the amplitude of the EEG signal in μV.
Figure 3
Figure 3
The TMSEEG data processing workflow. Steps highlighted by blue boxes are modular functions within the TMSEEG processing workflow. The program takes an input file in .SET format (conversion done in EEGLAB), creating intermediate datasets after each step for easy reprocessing.
Figure 4
Figure 4
Step 2 GUI for removing the large-amplitude TMS pulse artifact. Figures display the average butterfly plot of all EEG data epochs plotted over a time range of −150 ms to 50 ms relative to time of the test pulse in (A–C), and −1000 ms to 3000 ms relative to the first repetitive TMS (rTMS) pulse in (D). X-axes represent time in milliseconds and y-axes represent the amplitude of the EEG signal in μV. Sliders indicate the time range for data removal. The user can specify the time range for deletion using the provided sliders for four types of TMS-EEG paradigms: (A) single-pulse, (B) long-interval (100 ms) paired-pulse, (C) short-interval (5 ms) paired-pulse, and (D) rTMS (specifically intermittent theta burst stimulation).
Figure 5
Figure 5
Step 3 GUI for data cleaning. (A) The GUI for Step 3 is shown on the left. Right panel depicts the CHAN_DELETION matrix displaying the trials and channels tagged for removal. This matrix provides a visual inspection of deleted data for quality control (x-axis is the trial number and y-axis is the channel number). In the main GUI, the user can select an ATTRIBUTE value for data display using the drop-down menu. (B) GUI for Plot Trials, displaying trials by their average ATTRIBUTE value (left); x-axis is the trial number and y-axis is the ATTRIBUTE value. Selecting a single dot opens the corresponding trial data (right), and in this window the user can choose to delete the entire trial (dot becomes red) or selectively remove specific channels in the trial. In the right window, x-axis represents time in milliseconds relative to presentation of TMS pulse and y-axis is the channel labels. (C) GUI for Plot Channels, displaying trials by their average ATTRIBUTE value for every channel (left). Selecting a channel’s scatter plot opens the corresponding channel data (right) and in this window the user can choose to delete the entire channel (scatter plot turns dark gray) or selectively remove specific trials within the channels (trials are marked in red and corresponding dot in scatter plot turns red). In the right window, x-axis represents time in milliseconds relative to presentation of TMS pulse and y-axis represents the amplitude of the EEG signal in μV. The bottom plot in the right window (highlighted in yellow) is the mean TEP (averaged across trials) for the selected channel.
Figure 6
Figure 6
Step 5 GUI for removing the TMS decay artifact. The plots in the top row are the 15 largest independent component analysis (ICA) components averaged across trials and sorted by component variance. Corresponding scalp plots are shown below. The bottom left butterfly plot displays the EEG data averaged over all trials before the removal of any ICA components (each colored line presents a channel). The bottom right butterfly plot shows the updated EEG data averaged over all trials after the deletion of tagged ICA components. Note the drastic change in the amplitude of the y-axis from the left panel (1000 μV) to the right panel (100 μV) and the unmasking of smaller evoked signals. For all waveform plots, x-axis represents time in milliseconds relative to presentation of TMS pulse and y-axis represents the amplitude of the EEG signal in μV.
Figure 7
Figure 7
Step 8 GUI for removing artifactual components in second round of ICA. Topographical display of the ICA components derived in the second round of ICA in order of variance (largest to smallest). Selecting the gray button above a component will display the temporal, spectral, and spatial characteristics of the corresponding component. Within this “child” GUI, selecting the data button will display the time domain characteristics of the ICA component over each trial. The user can identify the type of artifact using the drop-down menu. This marks the component for deletion. Viewing a component will highlight the component name in green, and marking it for deletion will highlight it in red. Update button on the top left of the main GUI displays the averaged butterfly plot of the EEG data assuming the deletion of the marked components. Comp Mat button on the top left of the main GUI is used to visualize the components marked for deletion for quality control (x-axis is the component type and y-axis is the component number).
Figure 8
Figure 8
TMSEEG software architecture. An illustration of the basic dependencies and relationships between TMSEEG functions. Arrows indicate that a higher level function calls on a lower level “child” function. Blue boxes indicate a functional step, while red boxes indicate that the step spawns a child GUI.
Figure 9
Figure 9
The impact of selective interpolation on data integrity. In this figure, we compare data from channel FC3 before (original) and after (interpolated) selective interpolation of a trial within FC3. (A) Amplitude of the original signal overlapped with the amplitude of the interpolated signal showing high correlation between the two signals in the time domain. X-axis represents time in milliseconds and y-axis represents the amplitude of the EEG signal in μV. (B) Power spectral density of the original signal overlapped with the power spectral density of the interpolated signal showing high correlation between the two signals in the frequency domain. X-axis represents frequency in Hertz and y-axis represents the spectral power of the EEG signal in μV2/Hz. (C) The cross-correlation between the original and interpolated signal closely matches with the autocorrelation of the original signal. X-axis represents the various time lags in milliseconds and y-axis represents the correlation coefficients at every time lag. (D) The coherence plot shows perfect coherence indicating that there is a high degree of linear dependency between the interpolated signal and the original signal. X-axis represents frequency in Hertz and y-axis represents the magnitude-squared coherence estimates using Welch’s averaged periodogram method at each frequency.
Figure 10
Figure 10
User-defined threshold for selective interpolation. (A) The schematic illustrates the data array modification when a user tags a trial within a channel (highlighted in red) or a full channel (highlighted in blue) for removal in Steps 3 or 9. Tagged trials within a channel are interpolated while tagged channels are deleted. (B) The scalp map highlights the main channel selected for interpolation (FC3 in black) and its neighboring channels that could be deleted. In (C,D), x-axes represent the total number of trials interpolated within channel FC3 and y-axes represent the corresponding percent root mean square error (% RMSE). Legend is used to illustrate the total number of deleted neighboring channels. These two plots depict the error in data interpolation in the (C) time domain and (D) frequency domain. They illustrate a linear increase in interpolation error when an increasing number of trials are interpolated within FC3. Interpolation error also increases with the cumulative deletion of neighboring channels.
Figure 11
Figure 11
Consequence of removing the large-amplitude TMS pulse artifact on the performance of ICA. In all panels, x-axes represent time in milliseconds relative to presentation of TMS pulse and y-axes represent the amplitude of the EEG signal in μV. The left panels show the average butterfly plot of the TEPs, depicting mean TEP (averaged across trials) for each channel before removing ICA components. The center panels depict the three largest ICA components identified in Step 4. In these panels, the three topographical maps are color coded to match their corresponding ICA components in the time domain. The right panels illustrate the average TEP after removing the three ICA components. (A) TMS pulse artifact was not deleted in Step 2. The ICA was not able to remove the decay artifact. (B) TMS pulse artifact was cut by removing a data segment between −5 ms to 10 ms. The TMS decay components were successfully removed using ICA.
Figure 12
Figure 12
Examples of artifacts that can be identified in Round 2 of ICA in Step 8. In each row, the left panel depicts the average butterfly plot of the TEPs before removing the artifact (x-axis represents time in ms relative to presentation of TMS pulse and y-axis represents the amplitude of the EEG signal in μV). The center panel displays the ICA component associated with the artifact (x-axis represents time in milliseconds relative to presentation of TMS pulse, y-axis represents the trial number and a color scale is used to depict the amplitude of the ICA component in μV). The right panel shows the averaged butterfly plot of the TEPs after removing the artifact (x-axis represents time in milliseconds relative to presentation of TMS pulse and y-axis represents the amplitude of the EEG signal in μV). Topographical maps in each panel illustrate the scalp projection of the artifactual component at the latency of the artifact. Rows illustrate the impact of removing (A) a residual TMS artifact with latency of 60 ms (identified in data collected during suprathreshold single pulse TMS applied to the left dorsolateral prefrontal cortex [DLPFC]), (B) auditory evoked potential (AEP) with latency of 90 ms and 170 ms (identified in data collected during suprathreshold single pulse sham TMS applied to the left motor cortex), and (C) eye blink artifact with latency of 80 ms (identified in data collected during suprathreshold single pulse TMS applied to the left DLPFC).
Figure 13
Figure 13
Tagging artifactual ICA components through TMSEEG toolbox. The top row displays the TMSEEG GUI for classification of ICA components and the visualization of the spatial, temporal and spectral properties of three ICA components (A–C). In each window, the spatial characteristics of the component is displayed on the top left corner (topographical plot), the magnitude of the component across trials is displayed in the top right corner (x-axis represents time in milliseconds relative to TMS pulse and y-axis represents trials), and the frequency spectrum of the component is displayed in the bottom left corner (x-axis represents frequency in Hertz and y-axis represents the power spectral density). The drop-down menu on the bottom-right allows for a convenient classification of the artifact type. The second row depicts the ICA components in the time-domain over five continuous trials. The user can access this time-domain depiction of components through the “Data” button embedded in the GUI. The displayed artifacts are: (A) muscle artifact (electromyography [EMG]) in the left panel, (B) cardiac artifact (electrocardiographic [EKG]) in the middle panel, and (C) bad electrode artifact in the right panel.
Figure 14
Figure 14
Illustration of the capability of TMSEEG in processing several types of single-pulse and paired-pulse TMS paradigms. Panels illustrate the average butterfly plot of the TEPs at the completion of each major processing step (1, 3, 5, 8 and 10). The channel closest to the stimulation site is highlighted in red in each plot (C3 for left motor cortex and F3 for DLPFC). X-axes represent time in milliseconds relative to presentation of TMS pulse and y-axes represent the amplitude of the EEG signal in μV. The topographical plots at the bottom illustrate the voltage scalp map at each significant peak of the butterfly plot from Step 10 in μV. The displayed TMS-EEG paradigms are: (A) single-pulse stimulation applied to the left motor cortex at rest, (B) single-pulse stimulation applied to the left motor cortex during active muscle contraction (cortical silent period paradigm), (C) single-pulse stimulation applied to the left DLPFC at rest, and (D) paired-pulse (long-interval cortical inhibition paradigm) applied to the left DLPFC at rest.

Similar articles

Cited by

References

    1. Chaumon M., Bishop D. V. M., Busch N. A. (2015). A practical guide to the selection of independent components of the electroencephalogram for artifact correction. J. Neurosci. Methods 250, 47–63. 10.1016/j.jneumeth.2015.02.025 - DOI - PubMed
    1. Daskalakis Z. J., Farzan F., Radhu N., Fitzgerald P. B. (2012). Combined transcranial magnetic stimulation and electroencephalography: its past, present and future. Brain Res. 1463, 93–107. 10.1016/j.brainres.2012.04.045 - DOI - PubMed
    1. Delorme A., Makeig S. (2004). EEGLAB: an open source toolbox for analysis of single-trial EEG dynamics including independent component analysis. J. Neurosci. Methods 134, 9–21. 10.1016/j.jneumeth.2003.10.009 - DOI - PubMed
    1. Delorme A., Sejnowski T., Makeig S. (2007). Enhanced detection of artifacts in EEG data using higher-order statistics and independent component analysis. Neuroimage 34, 1443–1449. 10.1016/j.neuroimage.2006.11.004 - DOI - PMC - PubMed
    1. Farzan F., Barr M. S., Hoppenbrouwers S. S., Fitzgerald P. B., Chen R., Pascual-Leone A., et al. . (2013). The EEG correlates of the TMS-induced EMG silent period in humans. Neuroimage 83, 120–134. 10.1016/j.neuroimage.2013.06.059 - DOI - PMC - PubMed

Publication types

MeSH terms