

Stimulation of Baroresponsive Parts of the Nucleus of the Solitary Tract Produces Nitric Oxide-mediated Choroidal Vasodilation in Rat Eye
- PMID: 27774055
- PMCID: PMC5053990
- DOI: 10.3389/fnana.2016.00094
Stimulation of Baroresponsive Parts of the Nucleus of the Solitary Tract Produces Nitric Oxide-mediated Choroidal Vasodilation in Rat Eye
Abstract
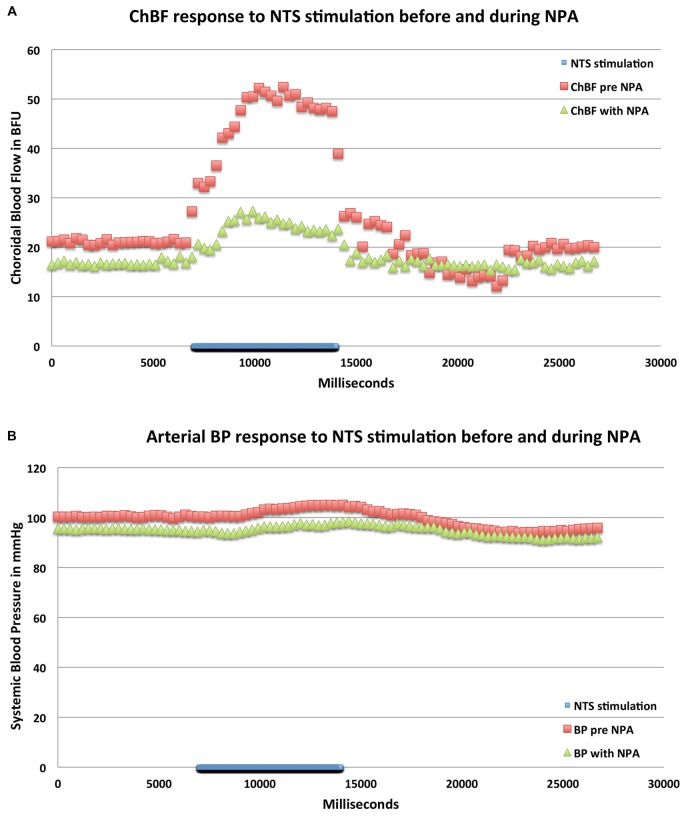
Preganglionic parasympathetic neurons of the ventromedial part of the superior salivatory nucleus (SSN) mediate vasodilation of orbital and choroidal blood vessels, via their projection to the nitrergic pterygopalatine ganglion (PPG) neurons that innervate these vessels. We recently showed that the baroresponsive part of the nucleus of the solitary tract (NTS) innervates choroidal control parasympathetic preganglionic neurons of SSN in rats. As this projection provides a means by which blood pressure (BP) signals may modulate choroidal blood flow (ChBF), we investigated if activation of baroresponsive NTS evokes ChBF increases in rat eye, using Laser Doppler Flowmetry (LDF) to measure ChBF transclerally. We found that electrical activation of ipsilateral baroresponsive NTS and its efferent fiber pathway to choroidal SSN increased mean ChBF by about 40-80% above baseline, depending on current level. The ChBF responses obtained with stimulation of baroresponsive NTS were driven by increases in both choroidal blood volume (ChBVol; i.e., vasodilation) and choroidal blood velocity (ChBVel; possibly due to orbital vessel dilation). Stimulation of baroresponsive NTS, by contrast, yielded no significant mean increases in systemic arterial blood pressure (ABP). We further found that the increases in ChBF with NTS stimulation were significantly reduced by administration of the neuronal nitric oxide (NO) synthase inhibitor Nω-propyl-l-arginine (NPA), thus implicating nitrergic PPG terminals in the NTS-elicited ChBF increases. Our results show that the NTS neurons projecting to choroidal SSN do mediate increase in ChBF, and thus suggest a role of baroresponsive NTS in the BP-dependent regulation of ChBF.
Keywords: autonomic; choroidal blood flow; nucleus of solitary tract; parasympathetic; superior salivatory nucleus.
Figures


Similar articles
-
Role of the superior salivatory nucleus in parasympathetic control of choroidal blood flow and in maintenance of retinal health.Exp Eye Res. 2021 May;206:108541. doi: 10.1016/j.exer.2021.108541. Epub 2021 Mar 16. Exp Eye Res. 2021. PMID: 33736985 Free PMC article.
-
Disinhibition of neurons of the nucleus of solitary tract that project to the superior salivatory nucleus causes choroidal vasodilation: Implications for mechanisms underlying choroidal baroregulation.Neurosci Lett. 2016 Oct 28;633:106-111. doi: 10.1016/j.neulet.2016.09.029. Epub 2016 Sep 20. Neurosci Lett. 2016. PMID: 27663135 Free PMC article.
-
Projections from the hypothalamic paraventricular nucleus and the nucleus of the solitary tract to prechoroidal neurons in the superior salivatory nucleus: Pathways controlling rodent choroidal blood flow.Brain Res. 2010 Oct 28;1358:123-39. doi: 10.1016/j.brainres.2010.08.065. Epub 2010 Aug 27. Brain Res. 2010. PMID: 20801105 Free PMC article.
-
Sub-foveal choroidal blood flow by LDF: measurement and application to the physiology and pathology of the choroidal circulation.Bull Soc Belge Ophtalmol. 2006;(302):185-94. Bull Soc Belge Ophtalmol. 2006. PMID: 17265798 Review.
-
Myopia Is an Ischemic Eye Condition: A Review from the Perspective of Choroidal Blood Flow.J Clin Med. 2024 May 9;13(10):2777. doi: 10.3390/jcm13102777. J Clin Med. 2024. PMID: 38792319 Free PMC article. Review.
Cited by
-
Neural control of choroidal blood flow.Prog Retin Eye Res. 2018 May;64:96-130. doi: 10.1016/j.preteyeres.2017.12.001. Epub 2017 Dec 8. Prog Retin Eye Res. 2018. PMID: 29229444 Free PMC article. Review.
-
Role of the superior salivatory nucleus in parasympathetic control of choroidal blood flow and in maintenance of retinal health.Exp Eye Res. 2021 May;206:108541. doi: 10.1016/j.exer.2021.108541. Epub 2021 Mar 16. Exp Eye Res. 2021. PMID: 33736985 Free PMC article.
-
Vagal Nerve Stimulation Attenuates Ischemia-Reperfusion Induced Retina Dysfunction in Acute Ocular Hypertension.Front Neurosci. 2019 Feb 11;13:87. doi: 10.3389/fnins.2019.00087. eCollection 2019. Front Neurosci. 2019. PMID: 30804746 Free PMC article.
-
Defective Choroidal Blood Flow Baroregulation and Retinal Dysfunction and Pathology Following Sympathetic Denervation of Choroid.Invest Ophthalmol Vis Sci. 2018 Oct 1;59(12):5032-5044. doi: 10.1167/iovs.18-24954. Invest Ophthalmol Vis Sci. 2018. PMID: 30326072 Free PMC article.
-
Evaluation of the Choroidal Thickness and Retinal Nerve Fiber Layer Thickness in Patients with Vasovagal Syncope.J Pers Med. 2025 Jun 18;15(6):259. doi: 10.3390/jpm15060259. J Pers Med. 2025. PMID: 40559121 Free PMC article.
References
-
- Alm A. (1992). “Ocular circulation,” in Adler’s Physiology of the Eye: Clinical Application, ed. Hart W. M. (St Louis, MO: Mosby; ), 198–227.
-
- Alm A., Bill A. (1973). Ocular and optic nerve blood flow at normal and increased intraocular pressures in monkeys (Macaca irus): a study with radioactively labelled microspheres including flow determinations in brain and some other tissues. Exp. Eye Res. 15, 15–29. 10.1016/0014-4835(73)90185-1 - DOI - PubMed
-
- Almond N. E., Wheatley A. M. (1992). Measurement of hepatic perfusion in rats by laser Doppler flowmetry. Am. J. Physiol. 262, G203–G209. - PubMed
Grants and funding
LinkOut - more resources
Full Text Sources
Other Literature Sources
Research Materials