. 2015 Oct 2;1(1):vev013.
doi: 10.1093/ve/vev013. eCollection 2015.

Connecting within-host dynamics to the rate of viral molecular evolution

Affiliations

Connecting within-host dynamics to the rate of viral molecular evolution

Kayla M Peck et al. Virus Evol. .

Abstract

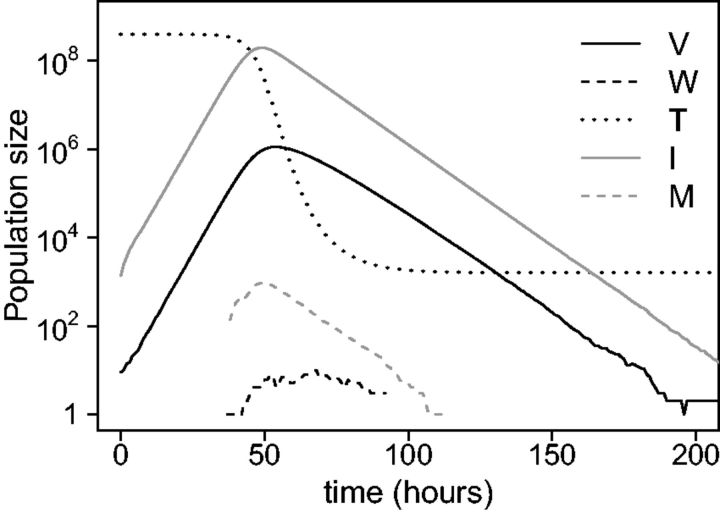
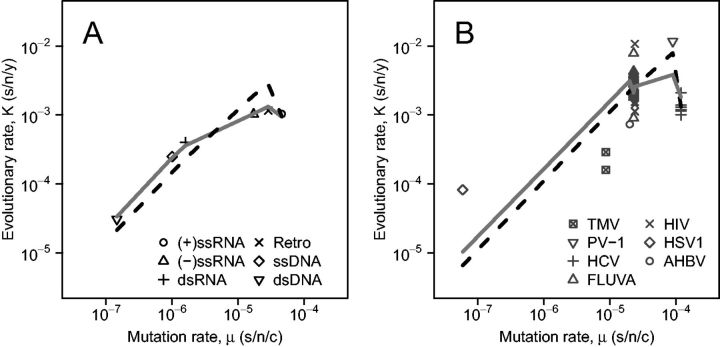
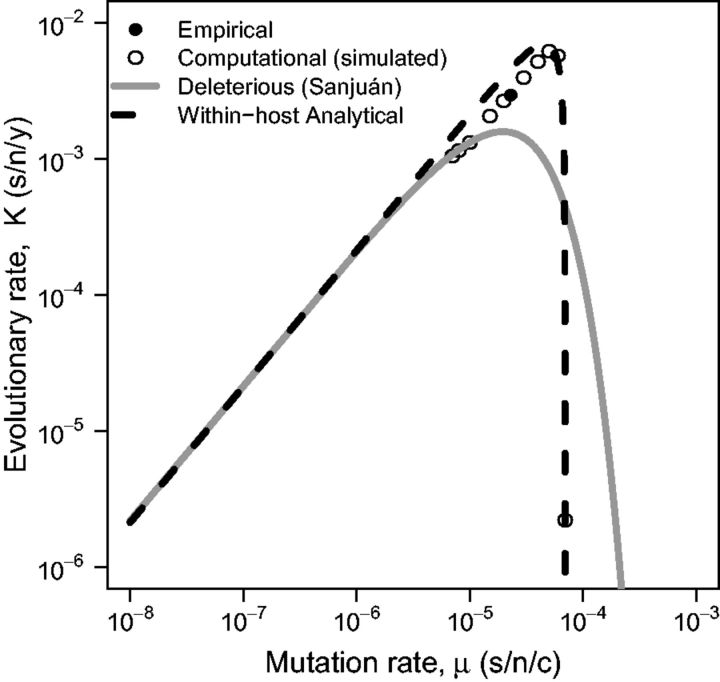
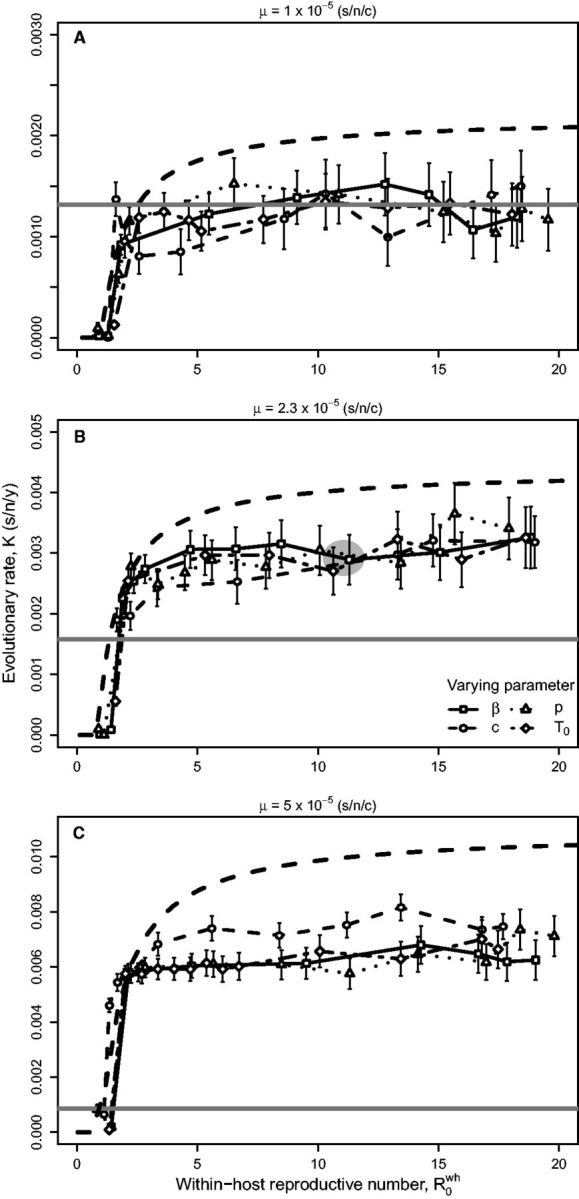
Viruses evolve rapidly, providing a unique system for understanding the processes that influence rates of molecular evolution. Neutral theory posits that the evolutionary rate increases linearly with the mutation rate. The occurrence of deleterious mutations causes this relationship to break down at high mutation rates. Previous studies have identified this as an important phenomenon, particularly for RNA viruses which can mutate at rates near the extinction threshold. We propose that in addition to mutation dynamics, viral within-host dynamics can also affect the between-host evolutionary rate. We present an analytical model that predicts the neutral evolution rate for viruses as a function of both within-host parameters and deleterious mutations. To examine the effect of more detailed aspects of the virus life cycle, we also present a computational model that simulates acute virus evolution using target cell-limited dynamics. Using influenza A virus as a case study, we find that our simulation model can predict empirical rates of evolution better than a model lacking within-host details. The analytical model does not perform as well as the simulation model but shows how the within-host basic reproductive number influences evolutionary rates. These findings lend support to the idea that the mutation rate alone is not sufficient to predict the evolutionary rate in viruses, instead calling for improved models that account for viral within-host dynamics.

Keywords: eevolutionary rate; influenza virus; mutation rate; virus evolution; within-host dynamics.


Figures

Figure 1.
Figure 1.
Population dynamics in a single infected host. Wildtype virus (V) and mutant virus (W) population within-host dynamics with corresponding target cell (T), wildtype virus-infected cell (I), and mutant virus-infected cell (M) populations shown for a single infection using default parameters (Table 1).
Figure 2.
Figure 2.
Fitting the within-host analytical and deleterious mutation models to virus data. (A) Log-scale mean evolutionary rates against mutation rates for each Baltimore class (data from Sanjuán (2012) and Sanjuán et al. (2010), respectively). (B) Evolutionary rates against mutation rates for individual viruses. For both (A) and (B), the solid line represents the deleterious mutation model prediction, while the dashed line indicates the prediction from our within-host analytical model. TMV, tobacco mosaic virus ((+)ssRNA); PV-1, poliovirus-1 ((+)ssRNA); HCV, hepatitis C virus ((+)ssRNA); FLUVA, influenza A virus ((-)ssRNA); HIV, human immunodeficiency virus (retro); HSV1, herpes simplex virus 1 (dsDNA); AHBV, avian hepatitis B virus (retro).
Figure 3.
Figure 3.
Between-host evolutionary rate K (s/n/y) against the mutation rate μ (s/n/c) for influenza A virus (R0wh=11.1). Data simulated using the computation model (open points, Kcomp) predicted by the deleterious mutation model implemented by Sanjuán (2012) (solid line, Kdel), and predicted by our within-host analytical model (dashed line, Kwh). Lines represent values calculated from the models based on independently estimated parameters and are not fit to the simulation (open) points. The simulation data closely approximates the reported value of influenza A virus evolutionary rate (closed point). Parameter values for both the computational and analytical models are defined in Table 1.
Figure 4.
Figure 4.
Between-host evolutionary rate Kcomp (s/n/y) against within-host reproductive number R0wh. Different specific within-host parameters were varied in the computational model to result in the range of R0wh values, with mutation rate held constant at (A) 1×10⁵, (B) 2.3×10⁵, or (C) 5×10⁵ (s/n/c). Solid (gray) lines indicate the predicted evolutionary rate by the deleterious mutation model used by Sanjuán (2012), while the dashed (black) lines indicate the predicted rates by our analytical model. Lines represent values calculated from the models using independent parameter estimates (Table 1) and are not a fit to the simulation points. The gray shaded area in (B) represents the empirical value of influenza (one standard error in each direction). Within-host parameter variables are cell infection rate β, virus production rate p, virus clearance rate c, and initial number of target cells T0.
Figure 5.
Figure 5.
Between-host evolutionary rate Kcomp (s/n/y) as a function of inoculum size Vinoc for various values of μ. Other parameter values are given in Table 1. The mean evolutionary rate does not change with different Vinoc.

References

    1. Abrahams M. R., et al. (2009) ‘Quantitating the Multiplicity of Infection with Human Immunodeficiency Virus Type 1 Subtype C Reveals a Non-Poisson Distribution of Transmitted Variants,’ Journal of Virology, 83: 3556–67. - PMC - PubMed
    1. Anderson J. P., Daifuku R., Loeb L. A. (2004) ‘Viral Error Catastrophe by Mutagenic Nucleosides,’ Annual Review of Microbiology, 58: 183–205. - PubMed
    1. Baccam P., et al. (2006) ‘Kinetics of Influenza A Virus Infection in Humans,’ Journal of Virology, 80: 7590–9. - PMC - PubMed
    1. Bell D., et al. (2006) ‘Non-Pharmaceutical Interventions for Pandemic Influenza, International Measures,’ Emerging Infectious Diseases, 12: 81–7. - PMC - PubMed
    1. Belshaw R., et al. (2008) ‘Pacing a Small Cage: Mutation and RNA Viruses,’ Trends in Ecology and Evolution, 23: 188–93. - PMC - PubMed

LinkOut - more resources