. 2016 Jan 20;2(1):vev023.
doi: 10.1093/ve/vev023. eCollection 2016 Jan.

MERS-CoV recombination: implications about the reservoir and potential for adaptation

Affiliations

MERS-CoV recombination: implications about the reservoir and potential for adaptation

Gytis Dudas et al. Virus Evol. .

Abstract

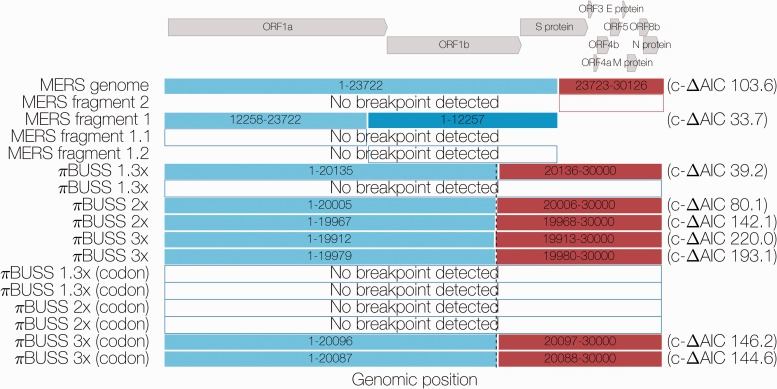
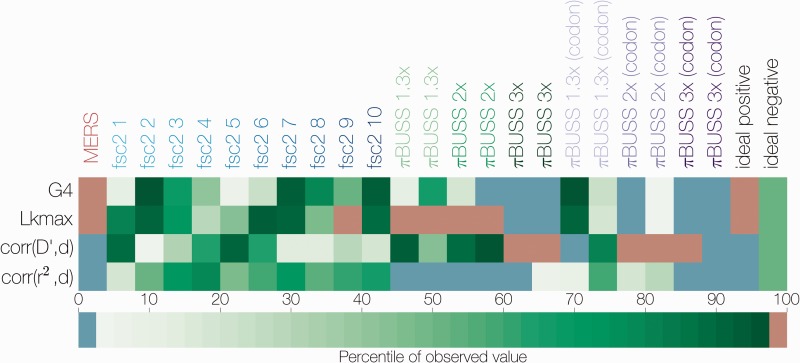
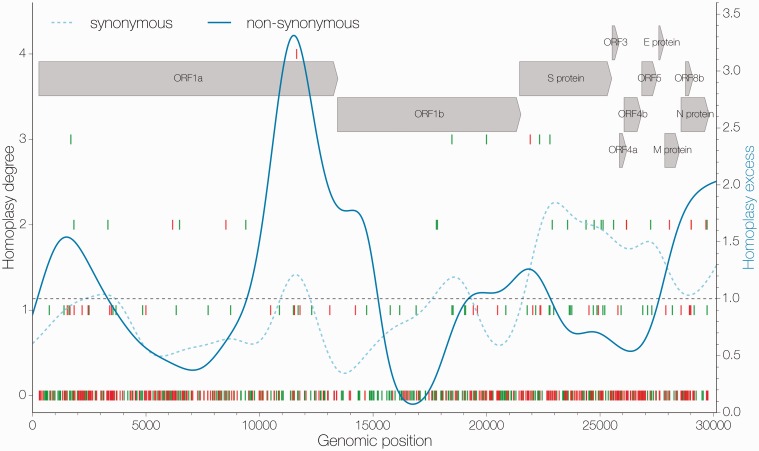
Recombination is a process that unlinks neighboring loci allowing for independent evolutionary trajectories within genomes of many organisms. If not properly accounted for, recombination can compromise many evolutionary analyses. In addition, when dealing with organisms that are not obligately sexually reproducing, recombination gives insight into the rate at which distinct genetic lineages come into contact. Since June 2012, Middle East respiratory syndrome coronavirus (MERS-CoV) has caused 1,106 laboratory-confirmed infections, with 421 MERS-CoV-associated deaths as of 16 April 2015. Although bats are considered as the likely ultimate source of zoonotic betacoronaviruses, dromedary camels have been consistently implicated as the source of current human infections in the Middle East. In this article, we use phylogenetic methods and simulations to show that MERS-CoV genome has likely undergone numerous recombinations recently. Recombination in MERS-CoV implies frequent co-infection with distinct lineages of MERS-CoV, probably in camels given the current understanding of MERS-CoV epidemiology.

Keywords: MERS; MERS-CoV; co-infection; coronavirus; homoplasy; recombination.


Figures

Figure 1.
Figure 1.
Summary of GARD results. Colored boxes indicate fragments resulting from GARD-inferred breakpoints with corrected ΔAIC values shown on the right. Dashed line indicates the actual position where the evolutionary model for simulated sequences under three levels of rate heterogeneity is changed. Arrows at the top indicate the positions and names of coding sequences within the MERS-CoV genome.
Figure 2.
Figure 2.
Summary of non-parametric tests for recombination. The percentile of the observed value for four statistics of LD decay (y axis) in the distribution of permuted datasets is indicated by color. Sequence datasets are shown on the x axis, starting with MERS-CoV sequences, followed by ten fastsimcoal2-simulated datasets and twelve empirically simulated datasets with different degrees of rate heterogeneity. Expected values for ideal datasets are shown in the last two columns, an ideal positive corresponds to the presence of recombination. Values falling between the 2.5th and 97.5th percentile are shown in green, values falling below the 2.5th percentile are in blue, those that are above the 97.5th percentile in red.
Figure 3.
Figure 3.
Distribution of apparent homoplasies. Position along the genome is shown on the x axis and homoplasy degree, the number of times a particular mutation has occurred in excess in the tree as inferred by maximum likelihood, is shown on the y axis (left). Individual mutations are marked by vertical lines, synonymous ones in green and non-synonymous in red. The ratio of apparent homoplasy over synapomorphy kernel density estimates (bandwidth = 0.1) is shown in blue for synonymous (dashed) and non-synonymous (solid) sites separately. Arrows at the top indicate the positions and names of coding sequences within the MERS-CoV genome.
Figure 4.
Figure 4.
Homoplasy prevalence in MERS-CoV and simulated datasets. Bars show the proportion of all polymorphic sites that are homoplasic, split by homoplasy degree as inferred by maximum likelihood, in MERS-CoV and datasets simulated with different degrees of rate heterogeneity in the presence or absence of site-specific constraint in the form of a codon model. Homoplasy degree indicates how many times a given mutation has occurred in excess in the phylogenetic tree.
Figure 5.
Figure 5.
Summary of model comparisons. Difference in marginal likelihoods (Bayes factor) estimated by path-sampling between the worst model (linked strict molecular clock, unlinked trees) and all others. Asterisks indicate the best-performing model (unlinked relaxed clocks, linked trees, run 2) for MERS-CoV data. Analyses employing a relaxed molecular clock were run independently 3 times, those with a strict molecular clock 2 times. Marginal likelihoods estimated using stepping stone sampling gave identical results.
Figure 6.
Figure 6.
Mutations mapped onto a ML phylogeny. A maximum likelihood phylogeny of 85 MERS-CoV sequences with maximum likelihood-mapped mutations. Synapomorphies are shown as coloured ticks (coloured by coding sequence in which they occur) on branches where they occur. Homoplasies are shown as circles connected with coloured lines, colour corresponds with the coding sequence in which the mutation has occured. Mutations are positioned on the branches in proportion to where the mutation occurs in the genome, e.g. mutations shown towards the end of a branch correspond to mutations near the 3' terminus of the genome. Arrows at the top indicate the order, relative length and names of coding sequences within the MERS-CoV genome.

Similar articles

Cited by

References

    1. Aburizaiza A. S., et al. (2014) ‘Investigation of Anti-MERS-Coronavirus Antibodies in Blood Donors and Abbatoir Workers in Jeddah and Makkah, Kingdom of Saudi Arabia, Fall 2012’, Journal of Infectious Diseases, 209(2): 243–6. doi: 10.1093/infdis/jit589. - PMC - PubMed
    1. Adney D. R., et al. (2014) ‘Replication and Shedding of MERS-CoV in Upper Respiratory Tract of Inoculated Dromedary Camels’, Emerging Infectious Diseases, 20: 1999–2005. - PMC - PubMed
    1. Anisimova M., Nielsen R., Yang Z. (2003) ‘Effect of Recombination on the Accuracy of the Likelihood Method for Detecting Positive Selection at Amino Acid Sites’, Genetics, 164: 1229–36. - PMC - PubMed
    1. Assiri A., et al. (2013) ‘Epidemiological, Demographic, and Clinical Characteristics of 47 Cases of Middle East Respiratory Syndrome Coronavirus Disease from Saudi Arabia: A Descriptive Study’, The Lancet Infectious Diseases, 13: 752–61. - PMC - PubMed
    1. Baele G., et al. (2012) ‘Improving the Accuracy of Demographic and Molecular Clock Model Comparison While Accommodating Phylogenetic Uncertainty’, Molecular Biology and Evolution, 29: 2157–67. - PMC - PubMed