. 2016 Feb 27;2(1):vew004.
doi: 10.1093/ve/vew004. eCollection 2016 Jan.

Driving forces behind the evolution of the Aleutian mink disease parvovirus in the context of intensive farming

Affiliations

Driving forces behind the evolution of the Aleutian mink disease parvovirus in the context of intensive farming

Marta Canuti et al. Virus Evol. .

Abstract

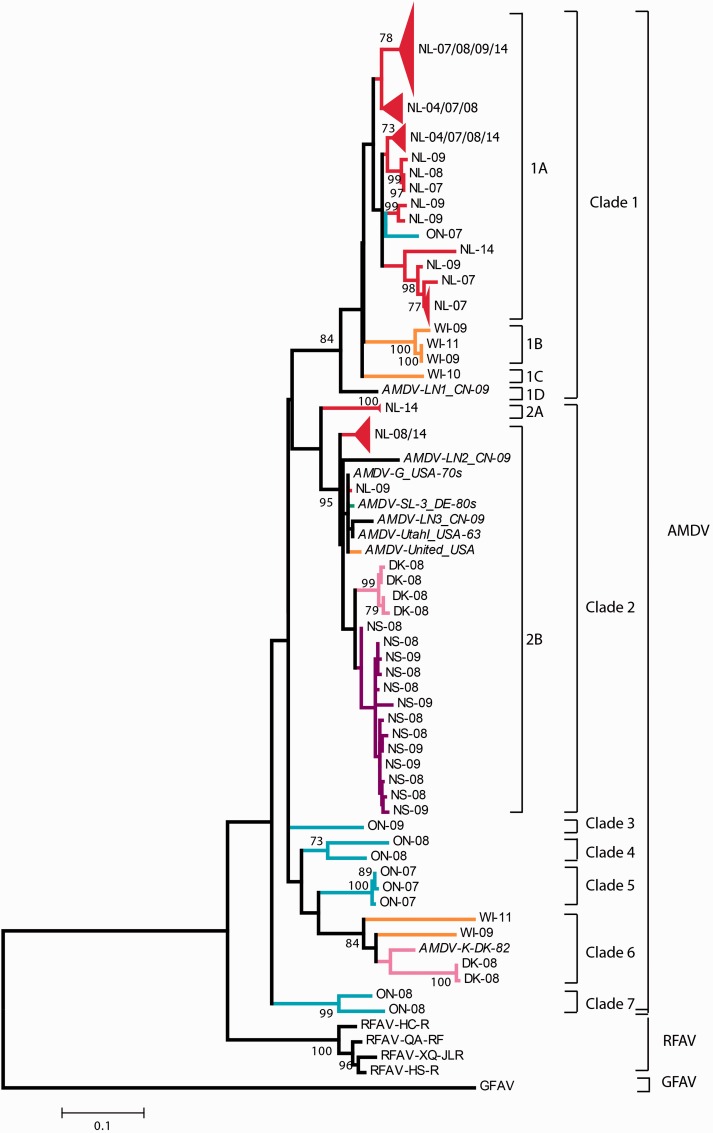
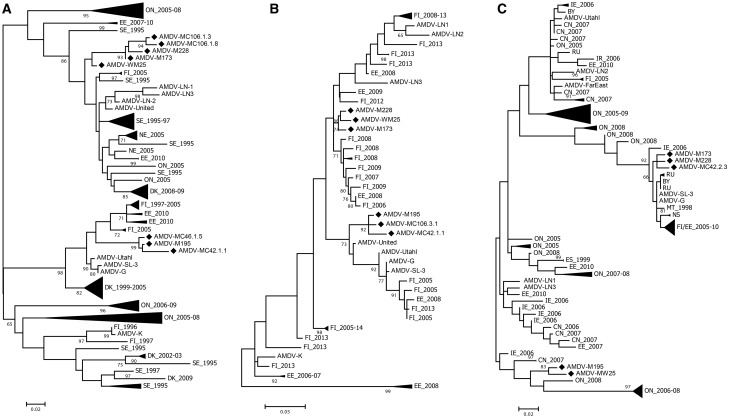
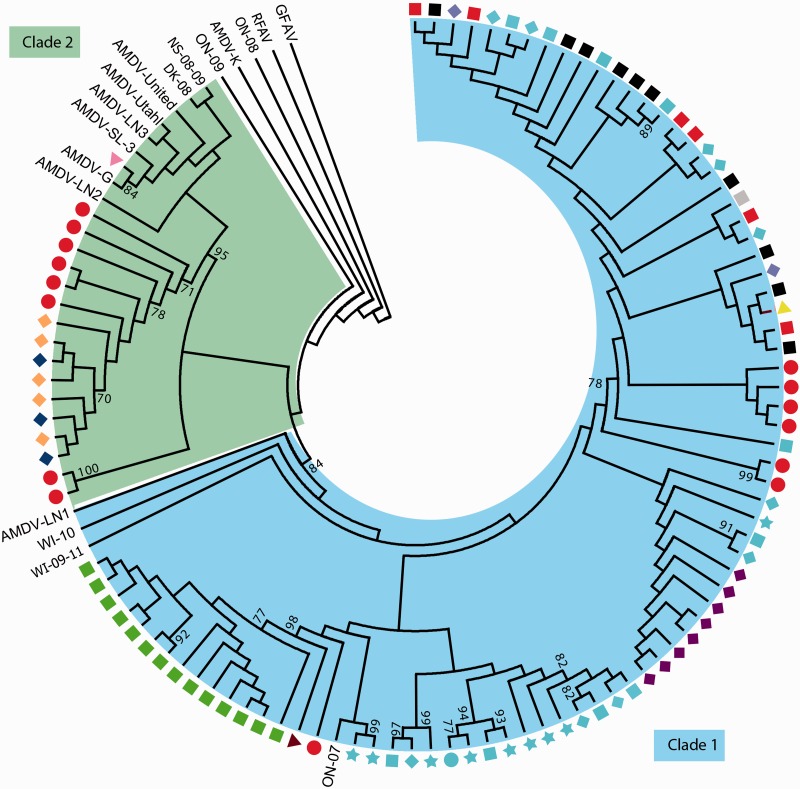
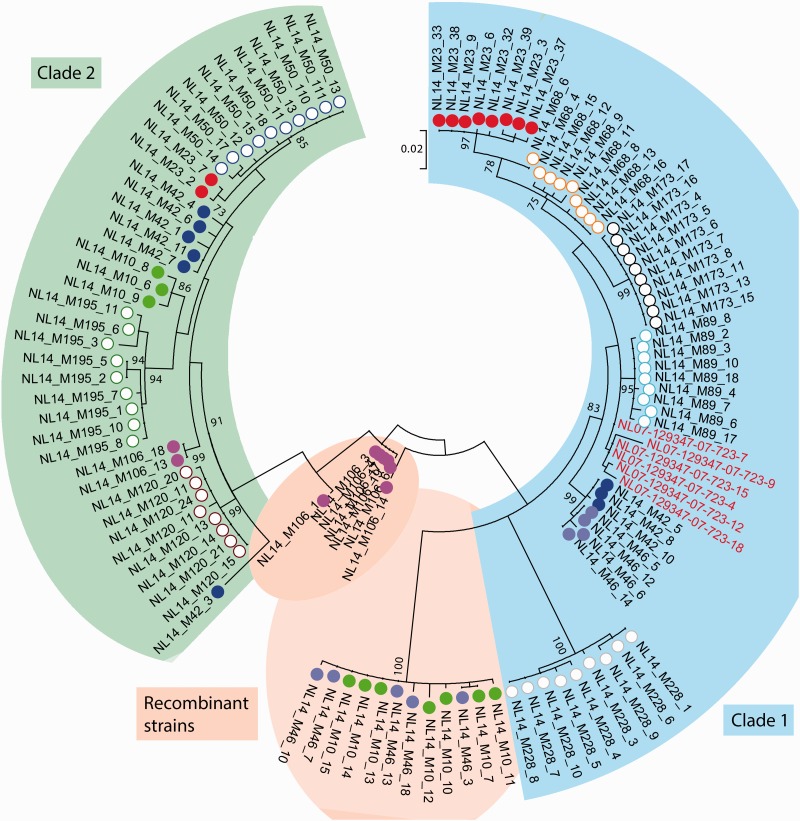
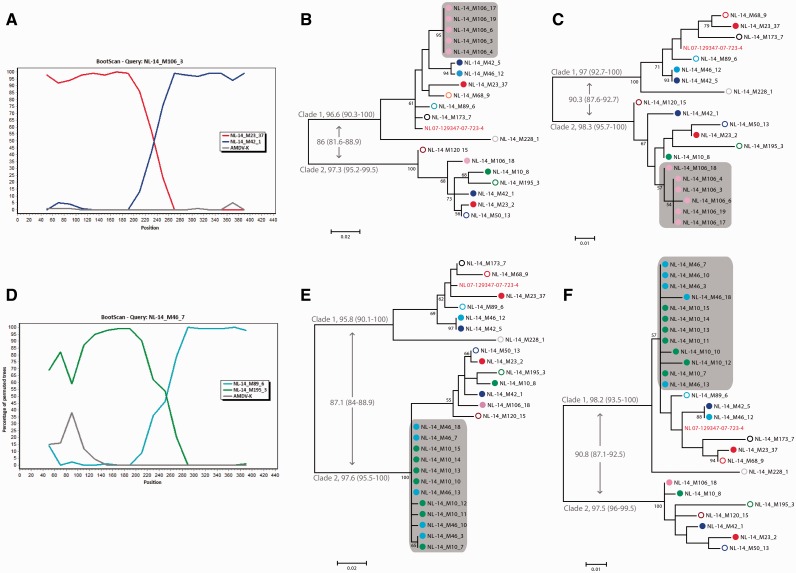
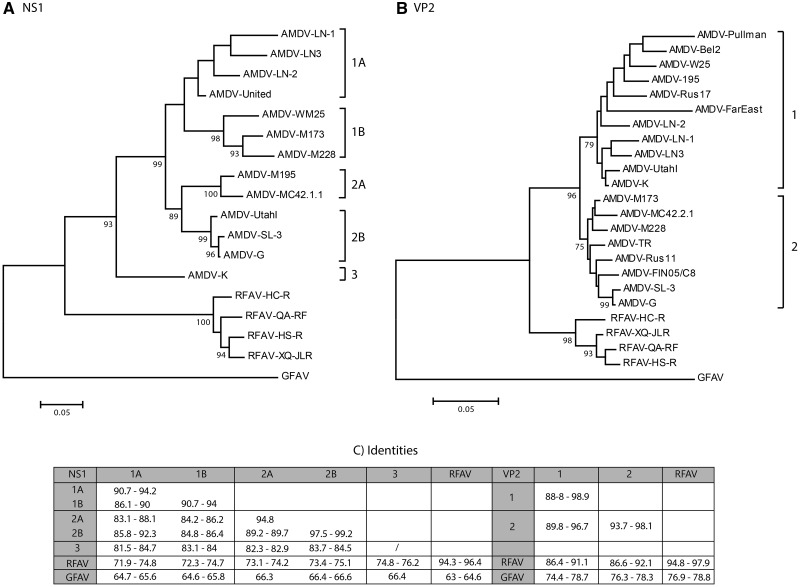
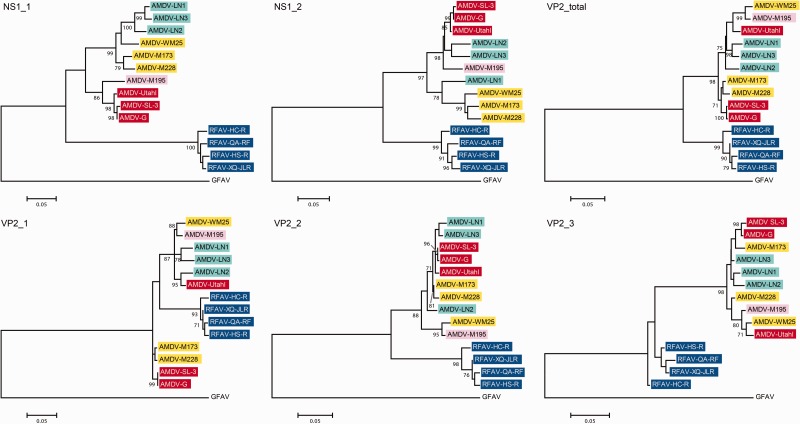
Aleutian mink disease virus (AMDV) causes plasmacytosis, an immune complex-associated syndrome that affects wild and farmed mink. The virus can also infect other small mammals (e.g., ferrets, skunks, ermines, and raccoons), but the disease in these hosts has been studied less. In 2007, a mink plasmacytosis outbreak began on the Island of Newfoundland, and the virus has been endemic in farms since then. In this study, we evaluated the molecular epidemiology of AMDV in farmed and wild animals of Newfoundland since before the beginning of the outbreak and investigated the epidemic in a global context by studying AMDV worldwide, thereby examining its diffusion and phylogeography. Furthermore, AMDV evolution was examined in the context of intensive farming, where host population dynamics strongly influence viral evolution. Partial NS1 sequences and several complete genomes were obtained from Newfoundland viruses and analyzed along with numerous sequences from other locations worldwide that were either obtained as part of this study or from public databases. We observed very high viral diversity within Newfoundland and within single farms, where high rates of co-infection, recombinant viruses and polymorphisms were observed within single infected individuals. Worldwide, we documented a partial geographic distribution of strains, where viruses from different countries co-exist within clades but form country-specific subclades. Finally, we observed the occurrence of recombination and the predominance of negative selection pressure on AMDV proteins. A surprisingly low number of immunoepitopic sites were under diversifying pressure, possibly because AMDV gains no benefit by escaping the immune response as viral entry into target cells is mediated through interactions with antibodies, which therefore contribute to cell infection. In conclusion, the high prevalence of AMDV in farms facilitates the establishment of co-infections that can favor the occurrence of recombination and enhance viral diversity. Viruses are then exchanged between different farms and countries and can be introduced into the wild, with the rapidly evolving viruses producing many parallel lineages.

Keywords: AMDV; Aleutian mink disease virus; amdoparvoviruses; parvoviruses; viral evolution; viral recombination.


Figures

Figure 1.
Figure 1.
Phylogenetic analysis of AMDV partial NS1 sequences obtained during this study and originating from different areas of the world. The evolutionary history of the partial NS1 region (nt 1207–1690) was inferred using the maximum-likelihood method (Felsenstein 1981) based on the HKY model (Hasegawa, Kishino, and Yano 1985), identified as the best fitting model after the model test analysis, using MEGA6 (Tamura et al. 2013). A discrete Gamma distribution was used to model evolutionary rate differences among sites (+G = 0.4098). The rate variation model allowed for some sites to be evolutionary invariable ([+I], 32.514% sites). The outcome of the bootstrap analysis (Felsenstein 1985) is shown next to the nodes, and branch lengths are proportional to genetic distances as indicated by the scale bar. Large groups of sequences originating from the same location and falling in the same clade have been collapsed at nodes into a triangle shape. Strains are labelled based on the original name (only for reference sequences, indicated in italics), sampling site (NL: Newfoundland; NS: Nova Scotia; ON: Ontario; WI: Wisconsin; USA: United States of America, state unknown; DK: Denmark; DE: Germany; CN: China) and year. Viral species, clades, and subclades are indicated by square brackets. Tree branches are colored based on sample origin (red: Newfoundland; purple: Nova Scotia; blue: Ontario; orange: USA; pink: Denmark; green: Germany; black: China).
Figure 2.
Figure 2.
Phylogenetic analyses of different genomic regions of AMDV strains identified worldwide. Trees were constructed with a 321-nt long portion of the NS1 genomic region (nt 602–922 of AMDV-G) of 179 different viruses (A), a 348-nt long portion of the NS1 genomic region (nt 1859–2208 of AMDV-G) of 56 different viruses (B) and a 280-nt long portion of the VP1 genomic region (nt 2949–3228 of AMDV-G) of 128 different viruses (C). Evolutionary histories were inferred with the maximum-likelihood method (Felsenstein 1981) based on the HKY model (Hasegawa, Kishino, and Yano 1985), identified as the best fitting model after the model test analysis, using MEGA6 (Tamura et al. 2013). A discrete Gamma distribution was used to model evolutionary rate differences among sites. The outcome of the bootstrap analysis (Felsenstein 1985) is shown next to the nodes, and branch lengths are proportional to genetic distances as indicated by the scale bars. Large groups of sequences originating from the same location and falling in the same clade have been collapsed at nodes into a triangle shape. Collection dates and sites (ON: Ontario; EE: Estonia; SE: Sweden; FI: Finland; NE: Netherlands; DK: Denmark; IE: Ireland; BY: Belarus; CN: China; RU: Russia; NS: Nova Scotia; MT: Montana; ES: Spain) are indicated. Sequences identified in this study from Newfoundland (NL) in 2014 are marked with a black diamond.
Figure 3.
Figure 3.
Phylogenetic relationship of AMDV strains from different locations in Newfoundland. The evolutionary history of the partial NS1 region (nt 1207–1690) of AMDV sequences was inferred using the maximum-likelihood method (Felsenstein 1981) based on the HKY model (Hasegawa, Kishino, and Yano 1985), identified as the best fitting model after the model test analysis, using MEGA6 (Tamura et al. 2013). A discrete Gamma distribution was used to model evolutionary rate differences among sites (+G = 0.4098). The rate variation model allowed for some sites to be evolutionary invariable ([+I], 32.514% sites). The outcome of the bootstrap analysis (Felsenstein 1985) is shown next to the nodes and only the tree topology is shown. Newfoundland strains are indicated by shapes and colors, where the shapes define the collection year (star: 2004; square: 2007; diamond: 2008; triangle: 2009; circle: 2014) and the colors indicate if the host was wild (light blue) or farmed (all other colors, with each farm represented by a different color). Strains identified in other areas are labelled according to the original name (only for reference sequences), sampling site (NS: Nova Scotia; ON: Ontario; WI: Wisconsin; DK: Denmark), and year.
Figure 4.
Figure 4.
Phylogenetic relationships of AMDV strains from different mink within a single farm. The evolutionary history of the partial NS1 region (nt 1207–1690) was inferred using the maximum-likelihood method (Felsenstein 1981) based on the HKY model (Hasegawa, Kishino, and Yano 1985) using MEGA6 (Tamura et al. 2013). A discrete Gamma distribution was used to model evolutionary rate differences among sites (+G = 0.1725). The outcome of the bootstrap analysis (Felsenstein 1985) is shown next to the nodes, and branch lengths are proportional to genetic distances as indicated by the scale bar. Strains identified in 2007 are indicated in red, while strains from 2014 are in black. Full circles represent viruses found in animals with co-infections, while empty circles represent single infections. Virus sequences with identical symbols and colors were from the same animal.
Figure 5.
Figure 5.
Recombination analysis of clonal AMDV strains from one mink farm. One event is displayed in panels A, B, and C, and the other event in panels D, E, and F. A BootScan analysis is shown for each event (A and D), and involved one of the recombinant sequences as query, sequences from relatives to the two parental strains, and AMDV-K as an outgroup. Trees built with the sequence partitions before the identified breakpoints are shown in panels B (nt 1207–1413) and E (nt 1207–1449), while trees built with the partitions after the breakpoints are shown in panels C (nt 1414–1690) and F (nt 1450–1690). The evolutionary histories were inferred using the maximum-likelihood method (Felsenstein 1981) based on the HKY model (Hasegawa, Kishino, and Yano 1985) using MEGA6 (Tamura et al. 2013). A discrete Gamma distribution was used to model evolutionary rate differences among sites. The outcome of the bootstrap analysis (Felsenstein 1985) is shown next to the nodes (only values above 50 are reported), and branch lengths are proportional to genetic distances as indicated by the scale bars. Full circles represent viruses found in animals with co-infections, while empty circles represent single infections. Virus sequences with identical symbols and colors were from the same animal. The phylogenetic placements of the recombinant strains are highlighted by shaded areas. Average identities (1−p-distance) in percentage values between and within clades (range) are reported in gray on each tree.
Figure 6.
Figure 6.
Analyses of the complete AMDV coding regions. (A) Phylogenetic tree constructed with NS1 protein sequences. The evolutionary history was inferred using the maximum-likelihood method (Felsenstein 1981) based on the JTT model (Jones, Taylor, and Thornton 1992), identified as the best fitting model after the model test analysis, using MEGA6 (Tamura et al. 2013). A discrete Gamma distribution was used to model evolutionary rate differences among sites (+G, parameter = 0.6942). The outcome of the bootstrap analysis (Felsenstein 1985) is shown next to the nodes and branch lengths are proportional to genetic distances as indicated by the scale bar. (B) Phylogenetic tree based on VP2 protein sequences. The evolutionary history was inferred using the maximum-likelihood method (Felsenstein 1981) based on the General Reverse Transcriptase model (Dimmic et al. 2002), identified as the best fitting model after the model test analysis, using MEGA6 (Tamura et al. 2013). A discrete Gamma distribution was used to model evolutionary rate differences among sites (+G = 0.286). The outcome of the bootstrap analysis (Felsenstein 1985) is shown next to the nodes and branch lengths are proportional to genetic distances as indicated by the scale bar. (C) Identities (1−p-distances) calculated within and between groups considering both NS1 and VP2 protein sequences. Values indicate the range of identities between pairs of sequences and are expressed as percentages. Clades correspond to those indicated on the trees displayed in panels A and B.
Figure 7.
Figure 7.
Phylogenetic reconstruction of complete AMDV genomes based on different genomic regions located between putative recombination breakpoints. Evolutionary histories were inferred with the maximum-likelihood method (Felsenstein 1981) based on the HKY model (Hasegawa, Kishino, and Yano 1985), identified as the best fitting model after the model test analysis, using MEGA6 (Tamura et al. 2013). A discrete Gamma distribution was used to model evolutionary rate differences among sites. The outcome of the bootstrap analysis (Felsenstein 1985) is shown next to the nodes and branch lengths are proportional to genetic distances as indicated by the scale bars. Trees are based on genomic regions between nucleotides 1–903 (NS1_1), 904–1926 (NS1_2) of the NS1 ORF and between nucleotides 1–1875 (VP2_total), 1–732 (VP2_1), 733–1320 (VP2_2), and 1321–1875 (VP2_3) of the VP2 ORF; all positions refer to the AMDV-G sequence. Viruses are highlighted with the same color throughout all trees.

Similar articles

Cited by

References

    1. Alexandersen S. (1986) ‘Acute Interstitial Pneumonia in Mink Kits: Experimental Reproduction of the Disease’, Veterinary Pathology, 23: 579–88. - PubMed
    1. Azarian T., et al. (2015) ‘Impact of Spatial Dispersion, Evolution, and Selection on Ebola Zaire Virus Epidemic Waves’, Scientific Reports, 5: 10170. - PMC - PubMed
    1. Bloom M. E., et al. (1988) ‘Nucleotide Sequence and Genomic Organization of Aleutian Mink Disease Parvovirus (ADV): Sequence Comparisons Between a Nonpathogenic and a Pathogenic Strain of ADV’, Journal of Virology, 62: 2903–15. - PMC - PubMed
    1. Bloom M. E., et al. (1997) ‘Expression of Aleutian Mink Disease Parvovirus Capsid Proteins in Defined Segments: Localization of Immunoreactive Sites and Neutralizing Epitopes to Specific Regions’, Journal of Virology, 71: 705–14. - PMC - PubMed
    1. Bodewes R., et al. (2014) ‘Viral Metagenomic Analysis of Feces of Wild Small Carnivores’, Virology Journal, 11: 89. - PMC - PubMed

LinkOut - more resources