. 2016 Apr 9;2(1):vew007.
doi: 10.1093/ve/vew007. eCollection 2016 Jan.

Exploring the temporal structure of heterochronous sequences using TempEst (formerly Path-O-Gen)

Affiliations

Exploring the temporal structure of heterochronous sequences using TempEst (formerly Path-O-Gen)

Andrew Rambaut et al. Virus Evol. .

Abstract

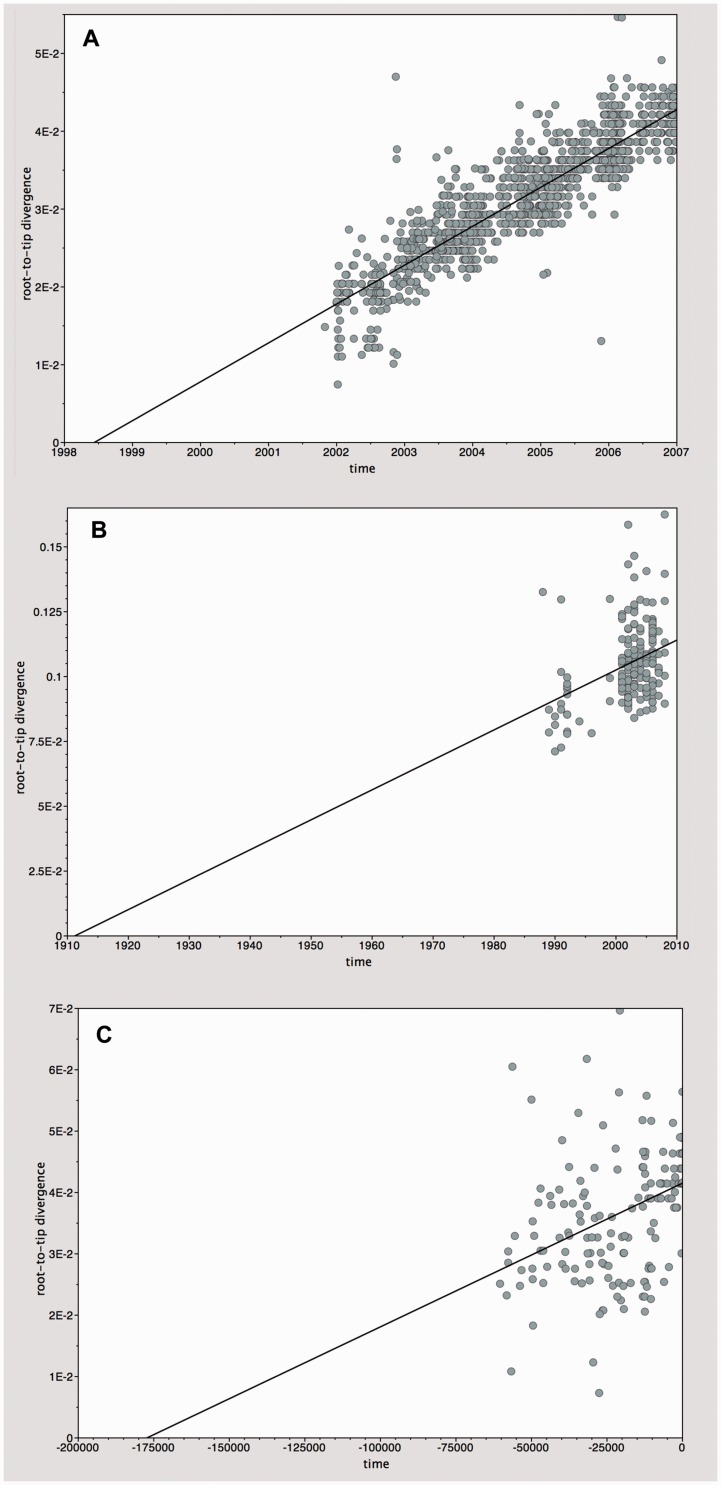
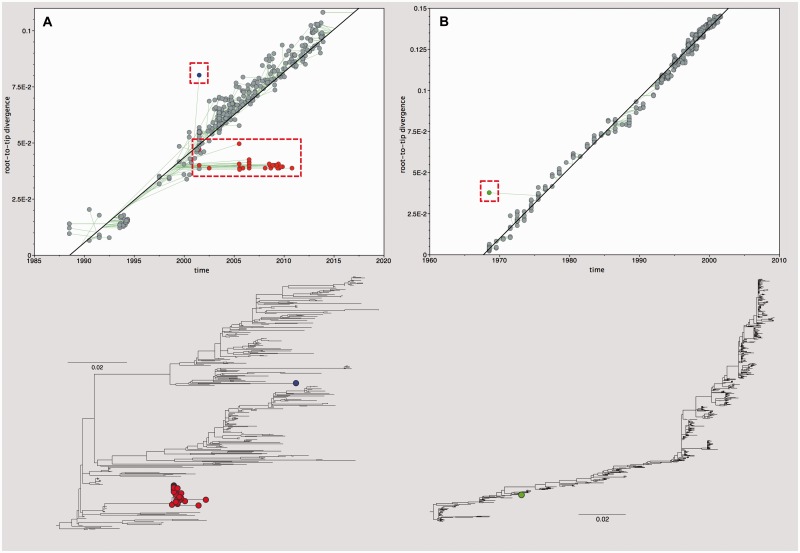
Gene sequences sampled at different points in time can be used to infer molecular phylogenies on a natural timescale of months or years, provided that the sequences in question undergo measurable amounts of evolutionary change between sampling times. Data sets with this property are termed heterochronous and have become increasingly common in several fields of biology, most notably the molecular epidemiology of rapidly evolving viruses. Here we introduce the cross-platform software tool, TempEst (formerly known as Path-O-Gen), for the visualization and analysis of temporally sampled sequence data. Given a molecular phylogeny and the dates of sampling for each sequence, TempEst uses an interactive regression approach to explore the association between genetic divergence through time and sampling dates. TempEst can be used to (1) assess whether there is sufficient temporal signal in the data to proceed with phylogenetic molecular clock analysis, and (2) identify sequences whose genetic divergence and sampling date are incongruent. Examination of the latter can help identify data quality problems, including errors in data annotation, sample contamination, sequence recombination, or alignment error. We recommend that all users of the molecular clock models implemented in BEAST first check their data using TempEst prior to analysis.

Keywords: evolutionary rate; model selection; molecular clock; phylogeny; regression.


Figures

Figure 1.
Figure 1.
User interface of TempEst. (A) The ‘tree’ panel and (B) the ‘root-to-tip’ regression panel. If a user selects a taxon or group of taxa in one panel, then the corresponding sequences or points will be highlighted in other panels (e.g., the four taxa highlighted in the tree panel are shown in blue in the root-to-tip panel). Components of the user interface discussed in the text are highlighted. (1) Button that initiates estimation of the best-fitting root location. (2) Regression analysis parameter estimates. (3) Tabs to switch between different data visualization panels. (4) Options to adjust how the tree is displayed. (5) Option to show ancestor traces (thin green lines). Ancestor traces for a subset of taxa are also shown if some taxa are highlighted.
Figure 2.
Figure 2.
Root-to-tip regression analyses. Plots of the root-to-tip genetic distance against sampling time are shown for phylogenies estimated from three alignments: (A) 1,441 HA gene sequences belonging to seasonal human influenza A/H3N2 virus, sampled between 2001 and 2006. (B) Whole-genome sequences of 167 HCV subtype1b strains, sampled between 1988 and 2008. (C) A mtDNA control region fragment from 182 bison samples, sampled from >60,000 years before the present to the present day (time = 0). Sampling dates are given as years before the present.
Figure 3.
Figure 3.
Heterochronous data quality control. (A) Root-to-tip regression plot, with ancestor traces shown, of 355 HA gene sequences belonging to the Classical swine lineage of influenza A/H1 virus. The outlier (blue circle) is strain A/Swine/North Carolina/98225/01(AF455676) which is thought to be a recombinant sequence (Lam et al. 2013). The group of outliers below the regression line (red circles) represents a vaccine lineage that has spent time in laboratory storage before resuming onward transmission (e.g., EU502884, DQ058215, HQ541680). Hence, this lineage has undergone less divergence from the tree root than expected. (B) Root-to-tip regression plot, with ancestor traces shown, of 614 HA gene sequences of human influenza A/H3N2 virus. The outlier (green circle) is strain A/Victoria/1968 (CY015508). This sequence has been retracted from GenBank, possibly the strain information does not match the sequence given, which appears to be of more recent provenance. Phylogenies for each regression plot are shown below, with outliers highlighted (scale bar represents substitutions per site).

References

    1. Biek R., et al. (2015) ‘Measurably Evolving Pathogens in the Genomic Era’, Trends in Ecology and Evolution, 30: 306–13. - PMC - PubMed
    1. Buonagurio D. A., et al. (1986) ‘Evolution of Human Influenza A Viruses over 50 Years: Rapid, Uniform Rate of Change in NS Gene’, Science, 232: 980–2. - PubMed
    1. Drummond A. J., et al. (2006) ‘Relaxed Phylogenetics and Dating with Confidence’, PLoS Biology, 4: e88. - PMC - PubMed
    1. Drummond A. J., et al. (2003a) ‘Measurably Evolving Populations’, Trends in Ecology and Evolution, 18: 481–8.
    1. Drummond A. J., Pybus O. G., Rambaut A. (2003b) ‘Inference of Viral Evolutionary Rates from Molecular Sequences’, Advances in Parasitology, 54: 331–58. - PubMed