. 2014 Sep 23:2:153-169.
doi: 10.2147/HP.S65242. eCollection 2014.

Effects of copper sulfate-oxidized or myeloperoxidase-modified LDL on lipid loading and programmed cell death in macrophages under hypoxia

Affiliations

Effects of copper sulfate-oxidized or myeloperoxidase-modified LDL on lipid loading and programmed cell death in macrophages under hypoxia

Benoit Vlaminck et al. Hypoxia (Auckl). .

Abstract

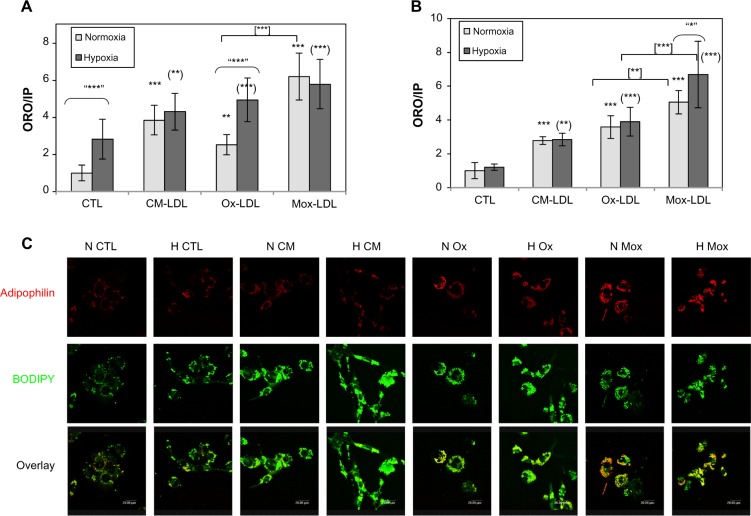
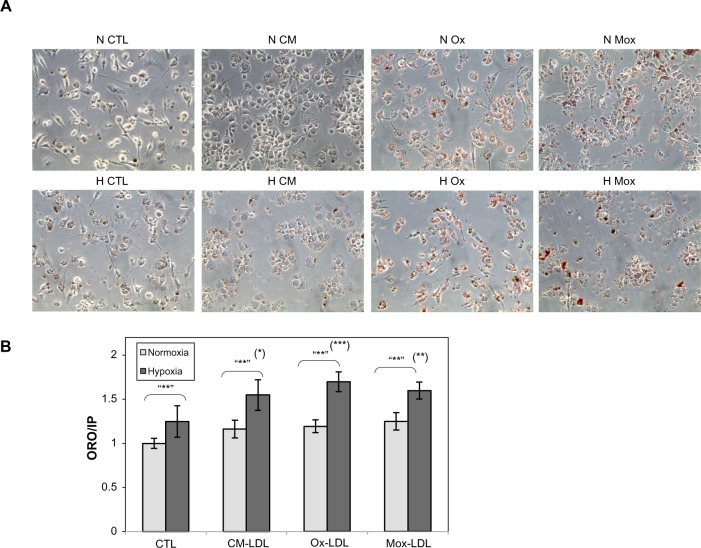
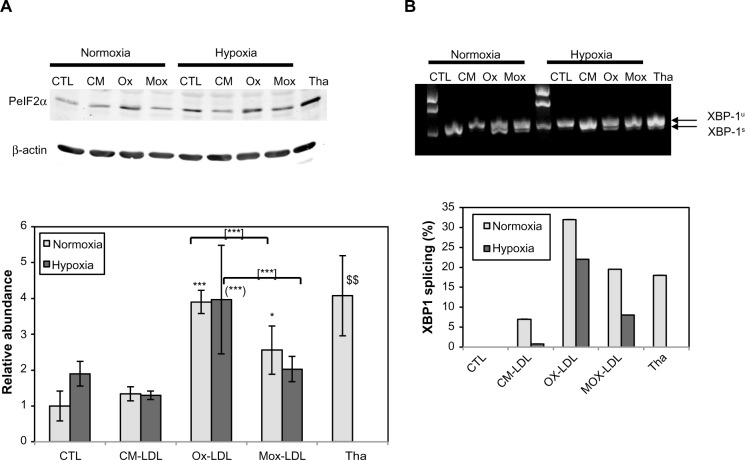
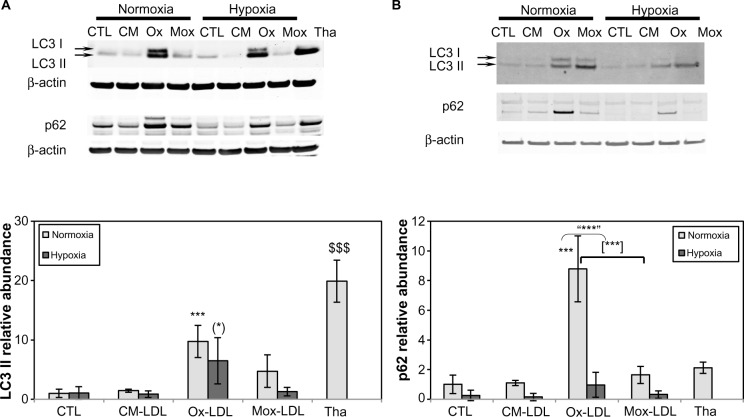
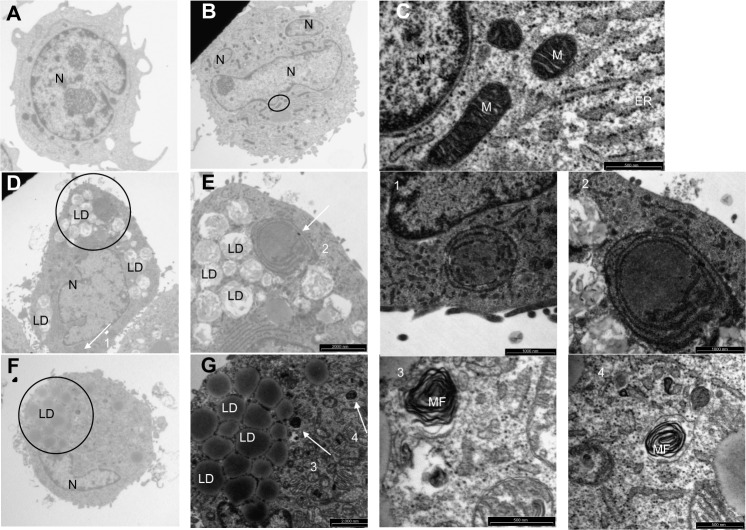
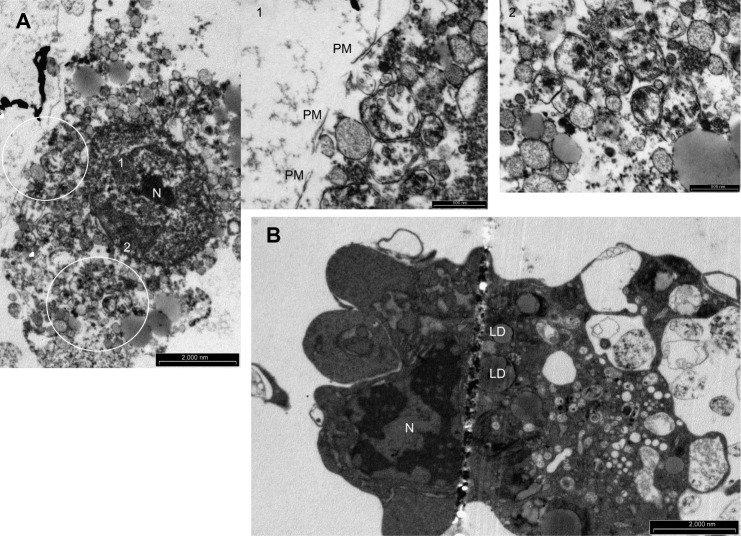
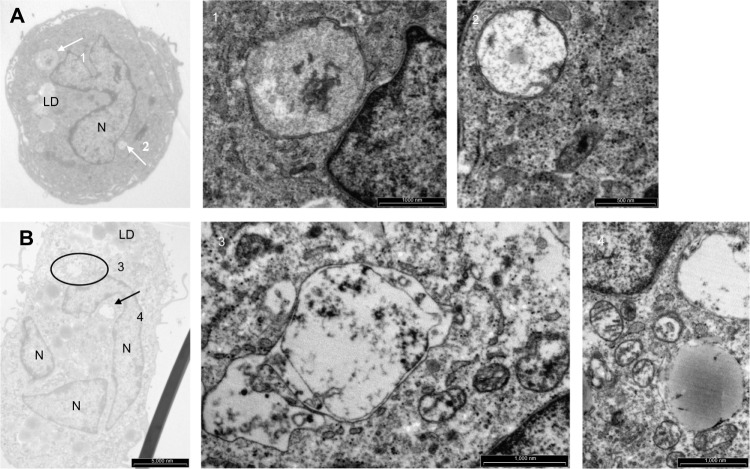
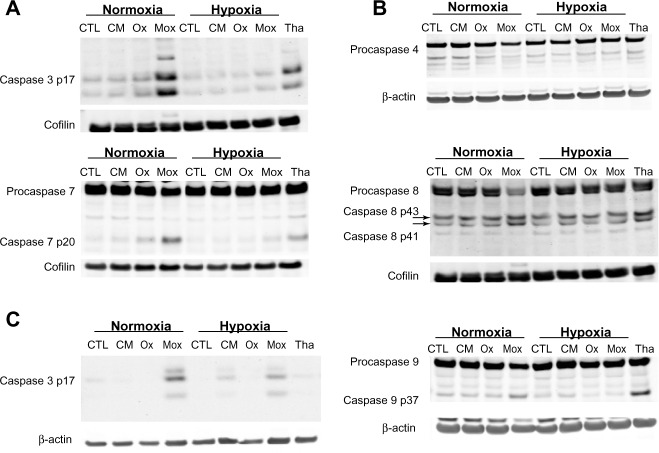
Atheromatous plaques contain heavily lipid-loaded macrophages that die, hence generating the necrotic core of these plaques. Since plaque instability and rupture is often correlated with a large necrotic core, it is important to understand the mechanisms underlying foam cell death. Furthermore, macrophages within the plaque are associated with hypoxic areas but little is known about the effect of low oxygen partial pressure on macrophage death. The aim of this work was to unravel macrophage death mechanisms induced by oxidized low-density lipoproteins (LDL) both under normoxia and hypoxia. Differentiated macrophages were incubated in the presence of native, copper sulfate-oxidized, or myeloperoxidase-modified LDL. The unfolded protein response, apoptosis, and autophagy were then investigated. The unfolded protein response and autophagy were triggered by myeloperoxidase-modified LDL and, to a larger extent, by copper sulfate-oxidized LDL. Electron microscopy observations showed that oxidized LDL induced excessive autophagy and apoptosis under normoxia, which were less marked under hypoxia. Myeloperoxidase-modified LDL were more toxic and induced a higher level of apoptosis. Hypoxia markedly decreased apoptosis and cell death, as marked by caspase activation. In conclusion, the cell death pathways induced by copper sulfate-oxidized and myeloperoxidase-modified LDL are different and are differentially modulated by hypoxia.

Keywords: Ox-LDL; UPR; apoptosis; autophagy; hypoxia; macrophages; myeloperoxidase.


Figures

Figure 1
Figure 1
Effect of hypoxia on lipid loading and on adipophilin abundance and localization. Notes: Macrophages were incubated for 72 hours with 100 μg/mL of low-density lipoproteins under hypoxia (1% oxygen) or normoxia (21% oxygen). After incubation, the (A) THP-1-derived macrophages or (B) peripheral blood monocytic cell-derived macrophages were fixed and stained with Oil Red O solution. The Oil Red O absorbance was then normalized by propidium iodide fluorescence. Results are expressed as the mean of two independent experiments, each performed in triplicate, ± one standard deviation. **P<0.01 and ***P<0.001 versus normoxic control. (**)P<0.01 and (***)P<0.001 versus hypoxic control. “*”P<0.05 and “***”P<0.001 versus corresponding normoxic cells. [**]P<0.01 and [***]P<0.001 myeloperoxidase-modified versus copper sulfate-oxidized low-density lipoproteins. (C) After incubation, the cells were fixed, permeabilized, and labeled with a specific antibody for adipophilin (red) and a specific probe for neutral lipids (green). Observations were then carried out with a confocal microscope with the photomultiplier kept constant. Abbreviations: CM(-LDL), cell-modified/native (low-density lipoproteins); CTL, control; H, hypoxia; IP: propidium iodide; Mox(-LDL), myeloperoxidase-modified (low-density lipoproteins); N, normoxia; ORO, Oil Red O; Ox(-LDL), copper sulfate-oxidized (low-density lipoproteins).
Figure 2
Figure 2
Effect of hypoxia on lipid loading. Notes: THP-1-derived macrophages were incubated for 72 hours with 200 μg/mL of low-density lipoproteins under hypoxia (1% oxygen) or normoxia (21% oxygen). After incubation, the THP-1-derived macrophages were fixed and stained with Oil Red O solution. (A) Cell morphology was examined under phase contrast microscopy (objective 40×). (B) The Oil Red O absorbance was normalized by propidium iodide fluorescence. Results are expressed as the mean of two independent experiments, each performed in triplicate, ± one standard deviation. (*)P<0.05; (**)P<0.01; and (***)P<0.001 versus hypoxic control. “**”P<0.01 versus corresponding normoxic cells. Abbreviations: CM(-LDL), cell-modified/native (low-density lipoproteins); CTL, control; H, hypoxia; IP: propidium iodide; Mox(-LDL), myeloperoxidase-modified (low-density lipoproteins); N, normoxia; ORO, Oil Red O; Ox(-LDL), copper sulfate-oxidized (low-density lipoproteins).
Figure 3
Figure 3
Effects of hypoxia on low-density lipoprotein-induced cytotoxicity. Notes: THP-1-derived macrophages were incubated for 72 hours with 200 μg/mL of low-density lipoproteins under hypoxia (1% oxygen) or normoxia (21% oxygen). After incubation, 3-(4,5-dimethylthiazol-2-yl)-2,5-diphenyltetrazolium bromide was added to the medium and the cells were placed for 2 hours and 30 minutes in the dark at 37°C in the presence of 5% carbon dioxide. Cells were then lysed and optical density was measured at 570 nm. Results are expressed as the mean of three independent experiments ± standard deviation. ***P<0.001 versus time-matched normoxic control. **P<0.01; ***P<0.001. Abbreviations: CM, cell-modified/native low-density lipoproteins; CTL, control; H, hypoxia; Mox, myeloperoxidase-modified low-density lipoproteins; N, normoxia; Ox, copper sulfate-oxidized low-density lipoproteins.
Figure 4
Figure 4
Effects of hypoxia on low-density lipoprotein-induced unfolded protein response. Notes: THP-1-derived macrophages were incubated for 72 hours with 200 μg/mL of low-density lipoproteins under hypoxia (1% oxygen) or normoxia (21% oxygen) or with thapsigargin at 200 nM for 20 hours under normoxia. (A) The abundance of phosphorylated eIF2α was assessed by Western blotting from total protein extracts with specific antibodies. β-actin was used as the loading control. The histogram shows the ratio of the intensity of the phosphorylated eIF2α band related to the intensity of the β-actin band as the mean ratio of three independent experiments ± standard deviation. *P<0.05 and ***P<0.001 versus normoxic control. (***)P<0.001 versus hypoxic control. [***]P<0.001 myeloperoxidase-modified versus copper sulfate-oxidized low-density lipoproteins. $$P<0.001 thapsigargin versus control using Student’s t-test. (B) For this XBP1 splicing assay, total RNA extracts were performed after 72 hours of incubation. Complementary DNA was then used as a matrix for a polymerase chain reaction using probes designed from both sides of the spliced intron. Polymerase chain reaction products were loaded on 1.5% agarose gel containing propidium iodide and pictures were taken after electrophoresis. The histogram shows the quantification of the bands on the agarose gel. Abbreviations: CM(-LDL), cell-modified/native (low-density lipoproteins); CTL, control; H, hypoxia; Mox(-LDL), myeloperoxidase-modified (low-density lipoproteins); N, normoxia; Ox(-LDL), copper sulfate-oxidized (low-density lipoproteins); PeIF2α, phosphorylated eIF2α; Tha, thapsigargin.
Figure 5
Figure 5
Effects of hypoxia on low-density lipoprotein-induced autophagy. Notes: Macrophages were incubated for 72 hours with 200 μg/mL of oxidized/modified low-density lipoproteins under hypoxia (1% oxygen) or normoxia (21% oxygen) or with thapsigargin at 200 nM for 20 hours under normoxia for (A) THP-1-derived macrophages or (B) peripheral blood monocytic cell-derived macrophages. The abundance of LC3 and p62 was assessed by Western blot analysis from total protein extracts using specific antibodies. In both cases, β-actin was used as the loading control. Histograms show, for THP-1-derived macrophages, the ratio of the intensity of the LC3 II or p62 band related to the intensity of the β-actin band as the mean ratio of three independent experiments ± standard deviation. ***P<0.001 versus normoxic control. (*)P<0.05 versus hypoxic control. “***”P<0.001 versus corresponding normoxic cells. [***]P<0.001 myeloperoxidase-modified versus copper sulfate-oxidized low-density lipoproteins. $$$P<0.001 thapsigargin versus control using Student’s t-test. Abbreviations: CM(-LDL), cell-modified/native (low-density lipoproteins); CTL, control; H, hypoxia; Mox(-LDL), myeloperoxidase-modified (low-density lipoproteins); N, normoxia; Ox(-LDL), copper sulfate-oxidized (low-density lipoproteins); Tha, thapsigargin.
Figure 6
Figure 6
Effects of low-density lipoproteins on cell morphology. Notes: Macrophages were incubated for 72 hours with or without 200 μg/mL of low-density lipoproteins under normoxia (21% oxygen). After incubation, the cells were fixed and processed for analysis by transmission electron microscopy. (A and B) Cells incubated for 72 hours in normoxia without low-density lipoproteins (magnification 2,550×). (C) Enlargement of the area circled in (B) (magnification 30,000×). (D) Cells incubated for 72 hours under normoxia with copper sulfate-oxidized low-density lipoproteins (magnification 2,550×). (E) Enlargement of the area circled in (D) (magnification 6,200×). (F) Cells incubated under normoxia for 72 hours with myeloperoxidase-modified low-density lipoproteins (magnification 2,550×). (G) Enlargement of area circled in (F) (magnification 6,200×). (1) Enlargement of the structure pointed to by Arrow 1 in (D) (magnification 15,000×). (2) Enlargement of the structure pointed to by Arrow 2 in (E) (magnification 30,000×). (3) Enlargement of the structure pointed to by Arrow 3 in (G) (magnification 30,000×). (4) Enlargement of the structure pointed to by Arrow 4 in (G) (magnification 30,000×). Abbreviations: ER, endoplasmic reticulum; LD, lipid droplets; M, mitochondria; MF, myelin figures; N, nucleus.
Figure 7
Figure 7
Effects of oxidized low-density lipoproteins on cell morphology under normoxia. Notes: Macrophages were incubated for 72 hours with 200 μg/mL of low-density lipoproteins under normoxia (21% oxygen). After incubation, the cells were fixed and processed for analysis by transmission electron microscopy. (A) A damaged and vesicularized cell incubated for 72 hours under normoxia in the presence of myeloperoxidase-modified low-density lipoproteins (magnification 6,200×). (B) A damaged cell incubated during 72 hours in the presence of copper sulfate-oxidized low-density lipoproteins. (1) Enlargement of Area 1 circled in (A) (magnification 30,000×). (2) Enlargement of Area 2 circled in (A) (magnification 15,000×). Abbreviations: LD, lipid droplets; N, nucleus; PM, plasma membrane.
Figure 8
Figure 8
Effects of oxidized low-density lipoproteins on cell morphology under hypoxia. Notes: Macrophages were incubated for 72 hours with 200 μg/mL of low-density lipoproteins under hypoxia (1% oxygen). After incubation, the cells were fixed and processed for analysis by transmission electron microscopy. (A) Cells incubated for 72 hours under hypoxia in the presence of copper sulfate-oxidized low-density lipoproteins (magnification 2,550×). (B) Cells incubated for 72 hours under hypoxia in the presence of myeloperoxidase-modified low-density lipoproteins (magnification 2,550×). (1) Enlargement of the structure pointed to by Arrow 1 in (A), (magnification 15,000×). (2) Enlargement of the structure pointed to by Arrow 2 in (A) (magnification 30,000×). (3) Enlargement of the area circled in (B) (magnification 15,000×). (4) Enlargement of the structure pointed to by Arrow 4 in (B) (magnification 15,000×). Abbreviations: LD, lipid droplets; N, nucleus.
Figure 9
Figure 9
Effects of low-density lipoproteins and hypoxia on apoptosis. Notes: Macrophages were incubated for 72 hours with 200 μg/mL of low-density lipoproteins under hypoxia (1% oxygen) or normoxia (21% oxygen). (A) The abundance of cleaved caspase 3, procaspase 7, and cleaved caspase 7 was assessed by Western blot analysis from total protein extracts of THP-1-derived macrophages using specific antibodies. In both cases, cofilin was used as the loading control. (B) The abundance and cleavage profile of initiator caspases 4, 8, and 9 were assessed by Western blot analysis from total protein extracts of THP-1-derived macrophages using specific antibodies. For caspases 4 and 9, β-actin was used as the loading control; cofilin was used as the loading control for caspase 8. (C) The abundance of cleaved caspase 3 was assessed by Western blot analysis from total protein extracts of peripheral blood monocytic cell-derived macrophages using specific antibodies. β-actin was used as the loading control. Abbreviations: CM, cell-modified/native low-density lipoproteins; CTL, control; H, hypoxia; Mox, myeloperoxidase-modified low-density lipoproteins; N, normoxia; Ox, copper sulfate-oxidized low-density lipoproteins; Tha, thapsigargin.

Similar articles

Cited by

References

    1. Tabas I, Williams KJ, Boren J. Subendothelial lipoprotein retention as the initiating process in atherosclerosis: update and therapeutic implications. Circulation. 2007;116(16):1832–1844. - PubMed
    1. Williams KJ, Tabas I. The response-to-retention hypothesis of early atherogenesis. Arterioscler Thromb Vasc Biol. 1995;15(5):551–561. - PMC - PubMed
    1. Stocker R, Keaney JF., Jr Role of oxidative modifications in atherosclerosis. Physiol Rev. 2004;84(4):1381–1478. - PubMed
    1. Greaves DR, Gordon S. The macrophage scavenger receptor at 30 years of age: current knowledge and future challenges. J Lipid Res. 2009;50(Suppl):S282–S286. - PMC - PubMed
    1. Levitan I, Volkov S, Subbaiah PV. Oxidized LDL: diversity, patterns of recognition, and pathophysiology. Antioxid Redox Signal. 2010;13(1):39–75. - PMC - PubMed