

Implications of Visual Attention Phenomena for Models of Preferential Choice
- PMID: 27774490
- PMCID: PMC5058407
- DOI: 10.1037/dec0000049
Implications of Visual Attention Phenomena for Models of Preferential Choice
Erratum in
- Correction to Mullet and Stewart (2016)
Abstract
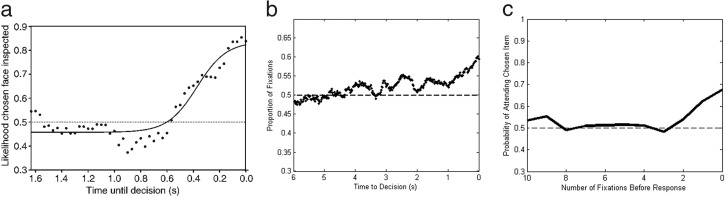
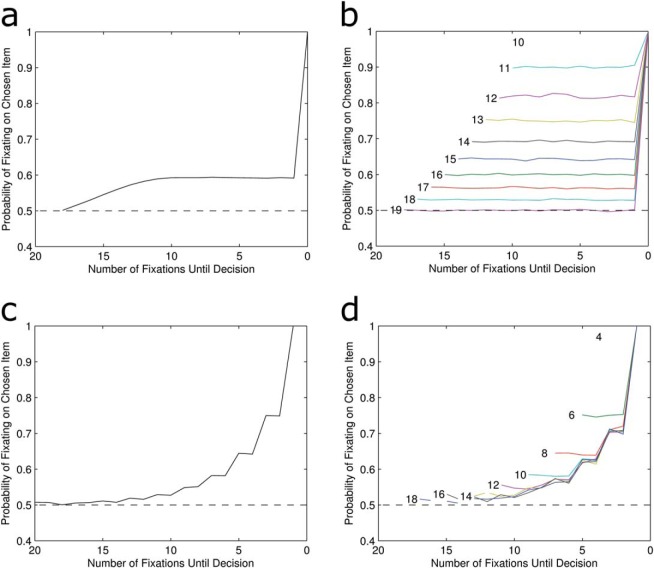
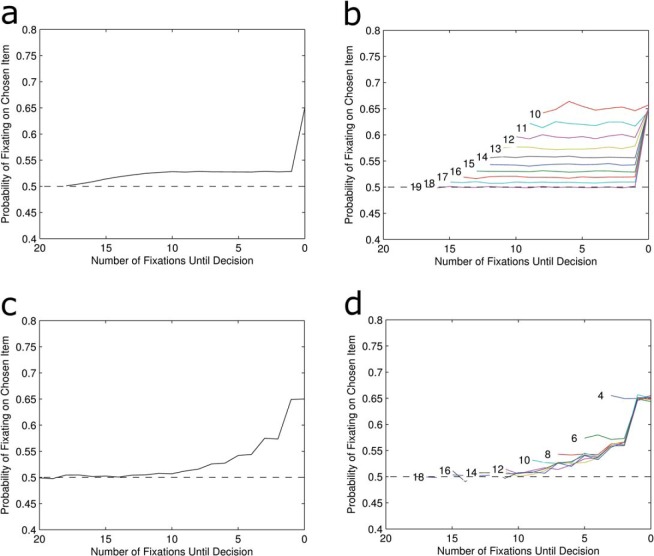
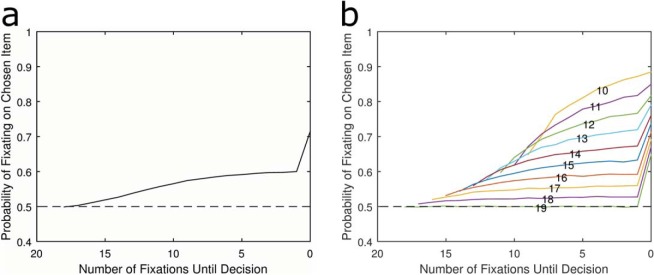
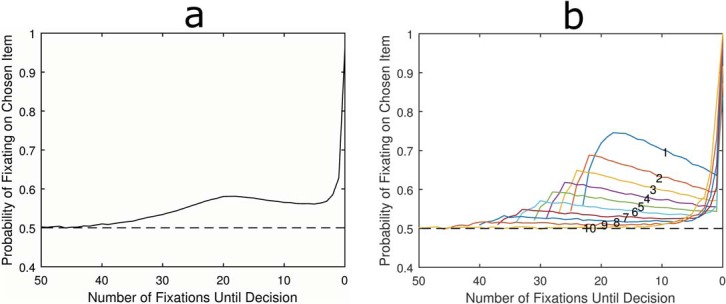
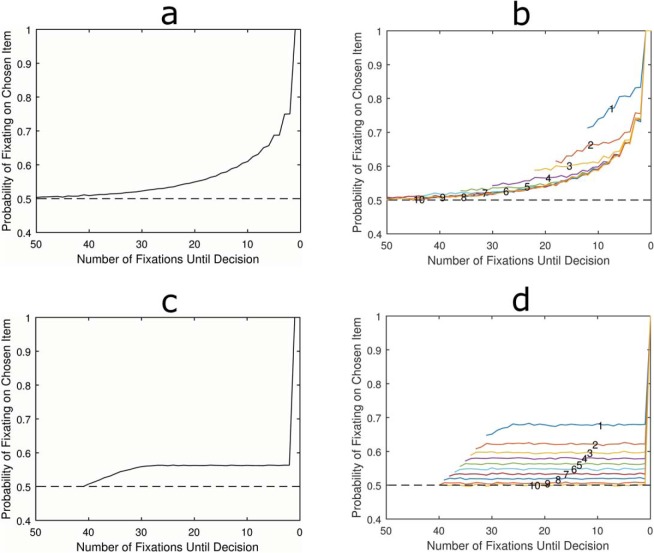
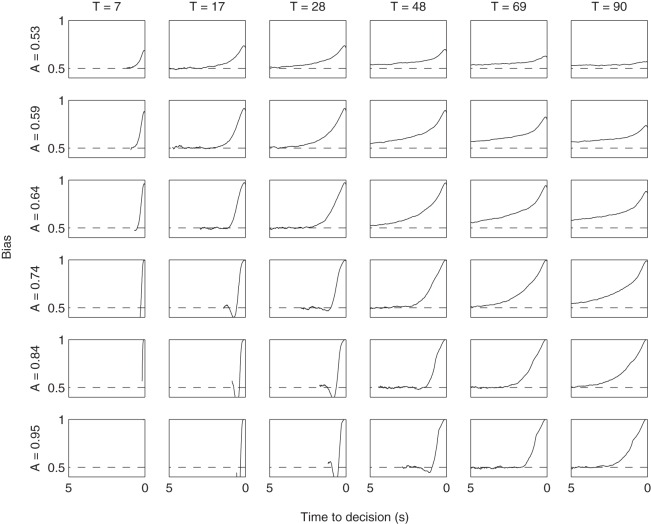
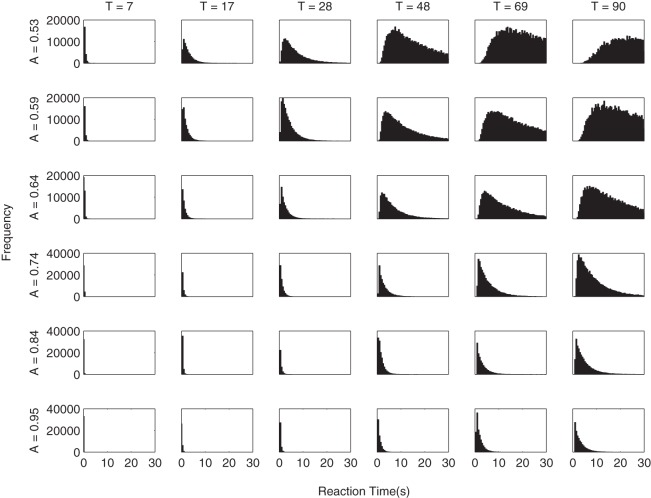
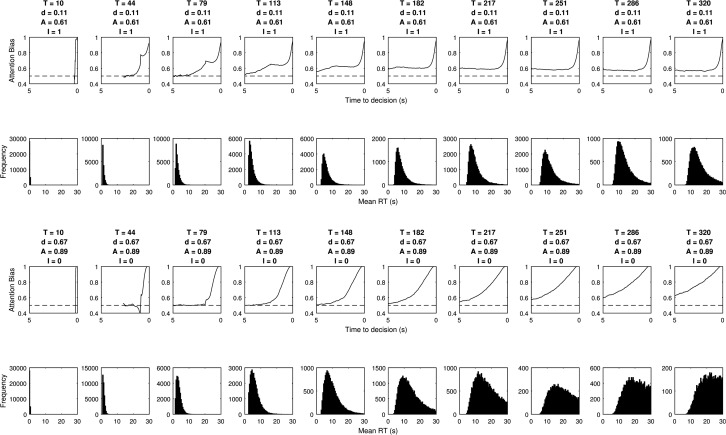
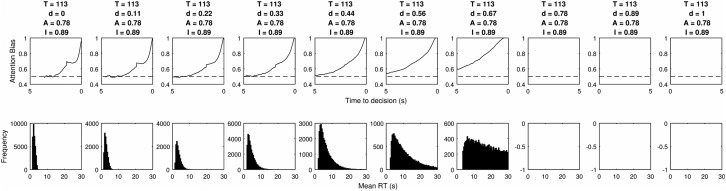
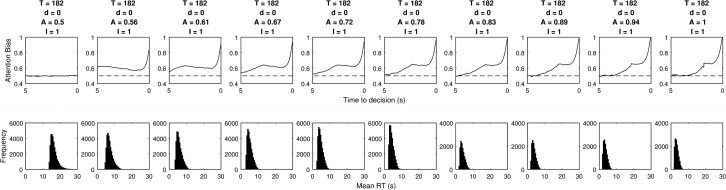
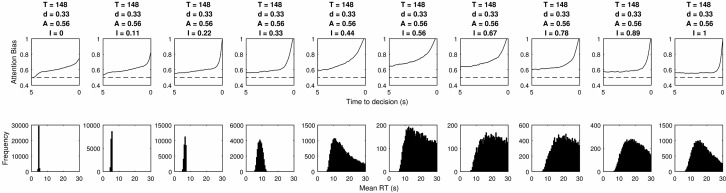
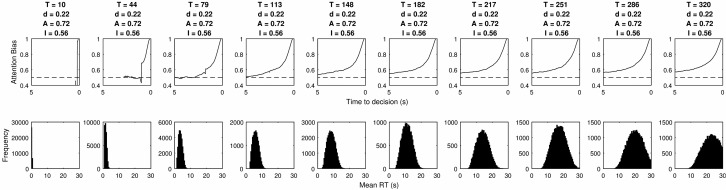
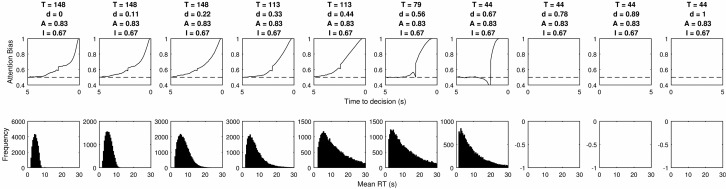
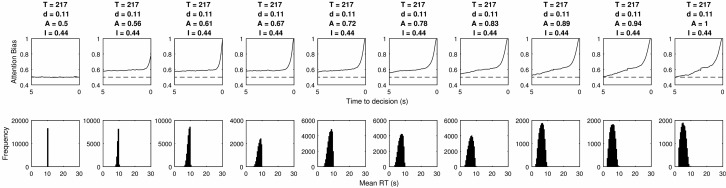
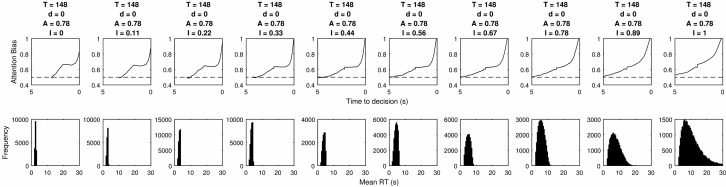
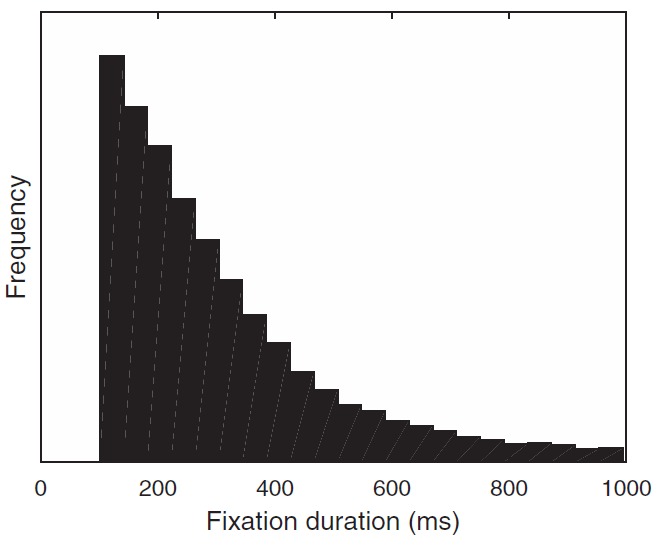
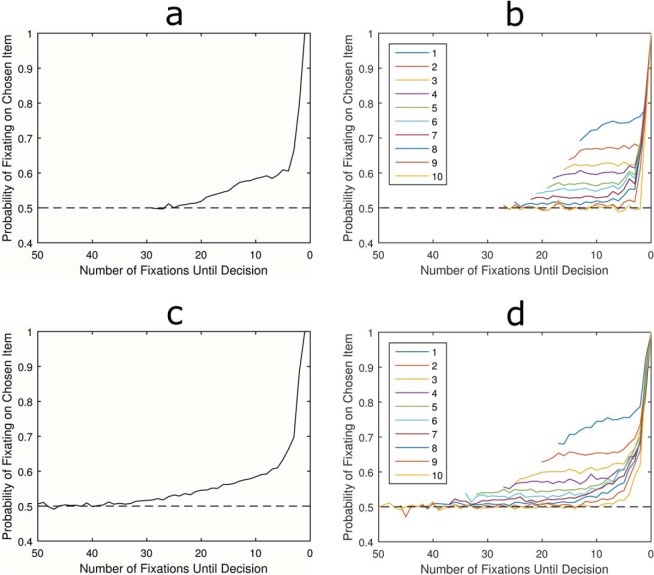
We use computational modeling to examine the ability of evidence accumulation models to produce the reaction time (RT) distributions and attentional biases found in behavioral and eye-tracking research. We focus on simulating RTs and attention in binary choice with particular emphasis on whether different models can predict the late onset bias (LOB), commonly found in eye movements during choice (sometimes called the gaze cascade). The first finding is that this bias is predicted by models even when attention is entirely random and independent of the choice process. This shows that the LOB is not evidence of a feedback loop between evidence accumulation and attention. Second, we examine models with a relative evidence decision rule and an absolute evidence rule. In the relative models a decision is made once the difference in evidence accumulated for 2 items reaches a threshold. In the absolute models, a decision is made once 1 item accumulates a certain amount of evidence, independently of how much is accumulated for a competitor. Our core result is simple-the existence of the late onset gaze bias to the option ultimately chosen, together with a positively skewed RT distribution means that the stopping rule must be relative not absolute. A large scale grid search of parameter space shows that absolute threshold models struggle to predict these phenomena even when incorporating evidence decay and assumptions of either mutual inhibition or feedforward inhibition.
Keywords: attention; choice models; drift diffusion; eye-tracking; gaze cascade.
Figures
Similar articles
-
Stronger attentional biases can be linked to higher reward rate in preferential choice.Cognition. 2022 Aug;225:105095. doi: 10.1016/j.cognition.2022.105095. Epub 2022 Apr 22. Cognition. 2022. PMID: 35468359
-
Uncovering the computational mechanisms underlying many-alternative choice.Elife. 2021 Apr 6;10:e57012. doi: 10.7554/eLife.57012. Elife. 2021. PMID: 33821787 Free PMC article.
-
Eye Movements in Strategic Choice.J Behav Decis Mak. 2016 Apr-Jul;29(2-3):137-156. doi: 10.1002/bdm.1901. Epub 2015 Oct 29. J Behav Decis Mak. 2016. PMID: 27513881 Free PMC article.
-
Eye tracking of attention in the affective disorders: a meta-analytic review and synthesis.Clin Psychol Rev. 2012 Dec;32(8):704-23. doi: 10.1016/j.cpr.2012.09.004. Epub 2012 Sep 20. Clin Psychol Rev. 2012. PMID: 23059623 Free PMC article. Review.
-
Guided Search 6.0: An updated model of visual search.Psychon Bull Rev. 2021 Aug;28(4):1060-1092. doi: 10.3758/s13423-020-01859-9. Epub 2021 Feb 5. Psychon Bull Rev. 2021. PMID: 33547630 Free PMC article. Review.
Cited by
-
The Future of Decisions From Experience: Connecting Real-World Decision Problems to Cognitive Processes.Perspect Psychol Sci. 2024 Jan;19(1):82-102. doi: 10.1177/17456916231179138. Epub 2023 Jun 30. Perspect Psychol Sci. 2024. PMID: 37390328 Free PMC article.
-
Neural correlates of visual attention during risky decision evidence integration.Neuroimage. 2021 Jul 1;234:117979. doi: 10.1016/j.neuroimage.2021.117979. Epub 2021 Mar 23. Neuroimage. 2021. PMID: 33771695 Free PMC article.
-
Amount and time exert independent influences on intertemporal choice.Nat Hum Behav. 2019 Apr;3(4):383-392. doi: 10.1038/s41562-019-0537-2. Epub 2019 Feb 25. Nat Hum Behav. 2019. PMID: 30971787 Free PMC article.
-
Multialternative decision by sampling: A model of decision making constrained by process data.Psychol Rev. 2018 Jul;125(4):512-544. doi: 10.1037/rev0000102. Psychol Rev. 2018. PMID: 29952622 Free PMC article.
-
The Attentional Drift Diffusion Model of Simple Perceptual Decision-Making.Front Neurosci. 2017 Aug 24;11:468. doi: 10.3389/fnins.2017.00468. eCollection 2017. Front Neurosci. 2017. PMID: 28894413 Free PMC article.
References
-
- Armel K. C., Beaumel A., & Rangel A. (2008). Biasing simple choices by manipulating relative visual attention. Judgment and Decision Making, 3, 396–403.
-
- Atalay A. S., Bodur H. O., & Rasolofoarison D. (2012). Shining in the center: Central gaze cascade effect on product choice. Journal of Consumer Research, 39, 848–866. 10.1086/665984 - DOI
-
- Fang X., Singh S., & Ahluwalia R. (2007). An examination of different explanations for the mere exposure effect. Journal of Consumer Research, 34, 97–103. 10.1086/513050 - DOI
LinkOut - more resources
Full Text Sources
Other Literature Sources