

Two-photon microscopy measurement of cerebral metabolic rate of oxygen using periarteriolar oxygen concentration gradients
- PMID: 27774493
- PMCID: PMC5066455
- DOI: 10.1117/1.NPh.3.4.045005
Two-photon microscopy measurement of cerebral metabolic rate of oxygen using periarteriolar oxygen concentration gradients
Abstract
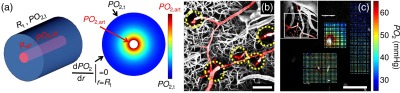
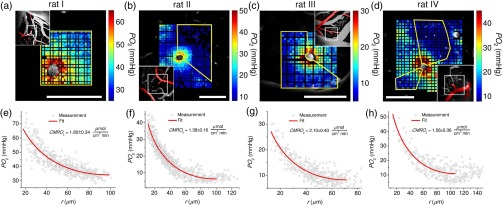
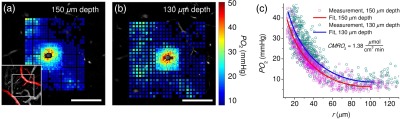
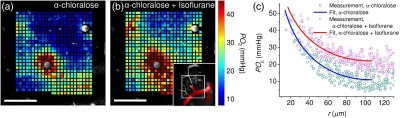
The cerebral metabolic rate of oxygen ([Formula: see text]) is an essential parameter for evaluating brain function and pathophysiology. However, the currently available approaches for quantifying [Formula: see text] rely on complex multimodal imaging and mathematical modeling. Here, we introduce a method that allows estimation of [Formula: see text] based on a single measurement modality-two-photon imaging of the partial pressure of oxygen ([Formula: see text]) in cortical tissue. We employed two-photon phosphorescence lifetime microscopy (2PLM) and the oxygen-sensitive nanoprobe PtP-C343 to map the tissue [Formula: see text] distribution around cortical penetrating arterioles. [Formula: see text] is subsequently estimated by fitting the changes of tissue [Formula: see text] around arterioles with the Krogh cylinder model of oxygen diffusion. We measured the baseline [Formula: see text] in anesthetized rats and modulated tissue [Formula: see text] levels by manipulating the depth of anesthesia. This method provides [Formula: see text] measurements localized within [Formula: see text] and it may provide oxygen consumption measurements in individual cortical layers or within confined cortical regions, such as in ischemic penumbra and the foci of functional activation.
Keywords: cerebral cortex; oxygen metabolism; oxygen partial pressure; phosphorescence; two-photon microscopy.
Figures
Similar articles
-
Spatial landscape of oxygen in and around microvasculature during epileptic events.Neurophotonics. 2017 Jan;4(1):010501. doi: 10.1117/1.NPh.4.1.010501. Epub 2017 Mar 11. Neurophotonics. 2017. PMID: 28386573 Free PMC article.
-
Blood flow mechanics and oxygen transport and delivery in the retinal microcirculation: multiscale mathematical modeling and numerical simulation.Biomech Model Mechanobiol. 2016 Jun;15(3):525-42. doi: 10.1007/s10237-015-0708-7. Epub 2015 Aug 1. Biomech Model Mechanobiol. 2016. PMID: 26232093
-
Cerebral blood oxygenation measurement based on oxygen-dependent quenching of phosphorescence.J Vis Exp. 2011 May 4;(51):1694. doi: 10.3791/1694. J Vis Exp. 2011. PMID: 21587157 Free PMC article.
-
Imaging extracellular potassium dynamics in brain tissue using a potassium-sensitive nanosensor.Neurophotonics. 2017 Jan;4(1):015002. doi: 10.1117/1.NPh.4.1.015002. Epub 2017 Feb 9. Neurophotonics. 2017. PMID: 28217712 Free PMC article.
-
Multimodal reconstruction of microvascular-flow distributions using combined two-photon microscopy and Doppler optical coherence tomography.Neurophotonics. 2015 Jan;2(1):015008. doi: 10.1117/1.NPh.2.1.015008. Epub 2015 Mar 12. Neurophotonics. 2015. PMID: 26157987 Free PMC article.
Cited by
-
A theoretical model for oxygen transport to the cerebral cortex: effects of flow redistribution by penetrating arterioles.Microvasc Res. 2025 Sep;161:104836. doi: 10.1016/j.mvr.2025.104836. Epub 2025 Jun 26. Microvasc Res. 2025. PMID: 40581282
-
Multichannel fiber photometry for mapping axonal terminal activity in a restricted brain region in freely moving mice.Neurophotonics. 2019 Jul;6(3):035011. doi: 10.1117/1.NPh.6.3.035011. Epub 2019 Sep 12. Neurophotonics. 2019. PMID: 31528656 Free PMC article.
-
Spatial and temporal patterns of nitric oxide diffusion and degradation drive emergent cerebrovascular dynamics.PLoS Comput Biol. 2020 Jul 27;16(7):e1008069. doi: 10.1371/journal.pcbi.1008069. eCollection 2020 Jul. PLoS Comput Biol. 2020. PMID: 32716940 Free PMC article.
-
Seizures elevate gliovascular unit Ca2+ and cause sustained vasoconstriction.JCI Insight. 2020 Oct 2;5(19):e136469. doi: 10.1172/jci.insight.136469. JCI Insight. 2020. PMID: 33004688 Free PMC article.
-
Baseline oxygen consumption decreases with cortical depth.PLoS Biol. 2022 Oct 27;20(10):e3001440. doi: 10.1371/journal.pbio.3001440. eCollection 2022 Oct. PLoS Biol. 2022. PMID: 36301995 Free PMC article.
References
-
- Mintun M. A., et al. , “Brain oxygen utilization measured with O-15 radiotracers and positron emission tomography,” J. Nucl. Med. 25(2), 177–187 (1984). - PubMed
-
- Buxton R. B., Introduction to Functional Magnetic Resonance Imaging: Principles and Techniques, Cambridge University Press, Cambridge, United Kingdom: (2002).
Grants and funding
LinkOut - more resources
Full Text Sources
Other Literature Sources
