. 2016 Oct 24:7:13219.
doi: 10.1038/ncomms13219.

Thousands of microbial genomes shed light on interconnected biogeochemical processes in an aquifer system

Affiliations

Thousands of microbial genomes shed light on interconnected biogeochemical processes in an aquifer system

Karthik Anantharaman et al. Nat Commun. .

Abstract

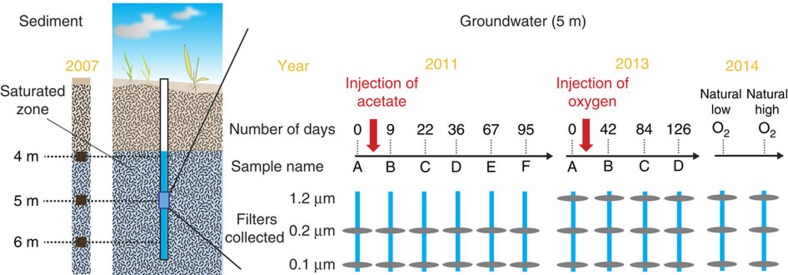
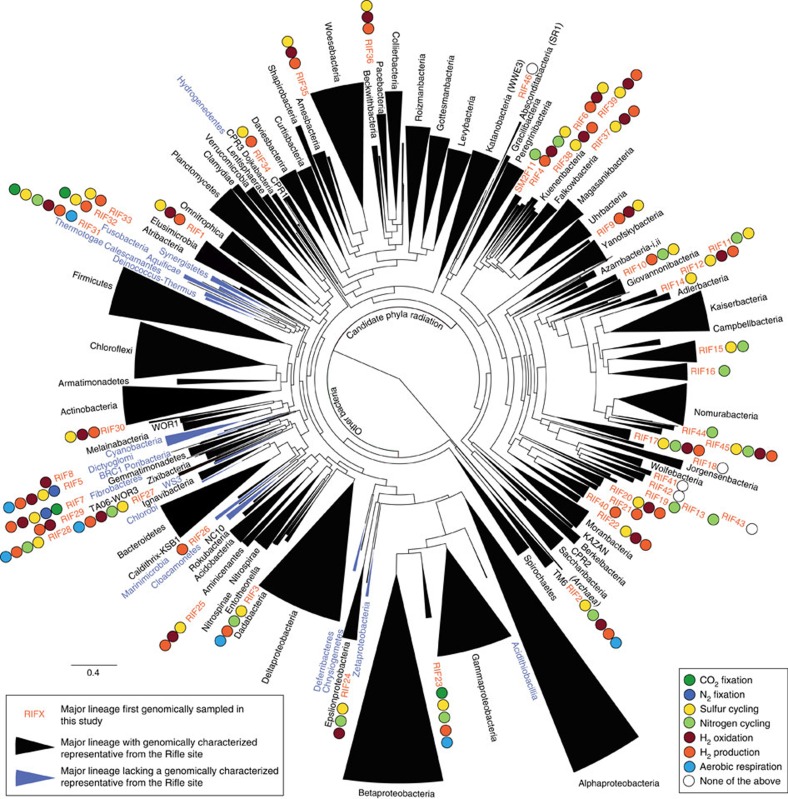
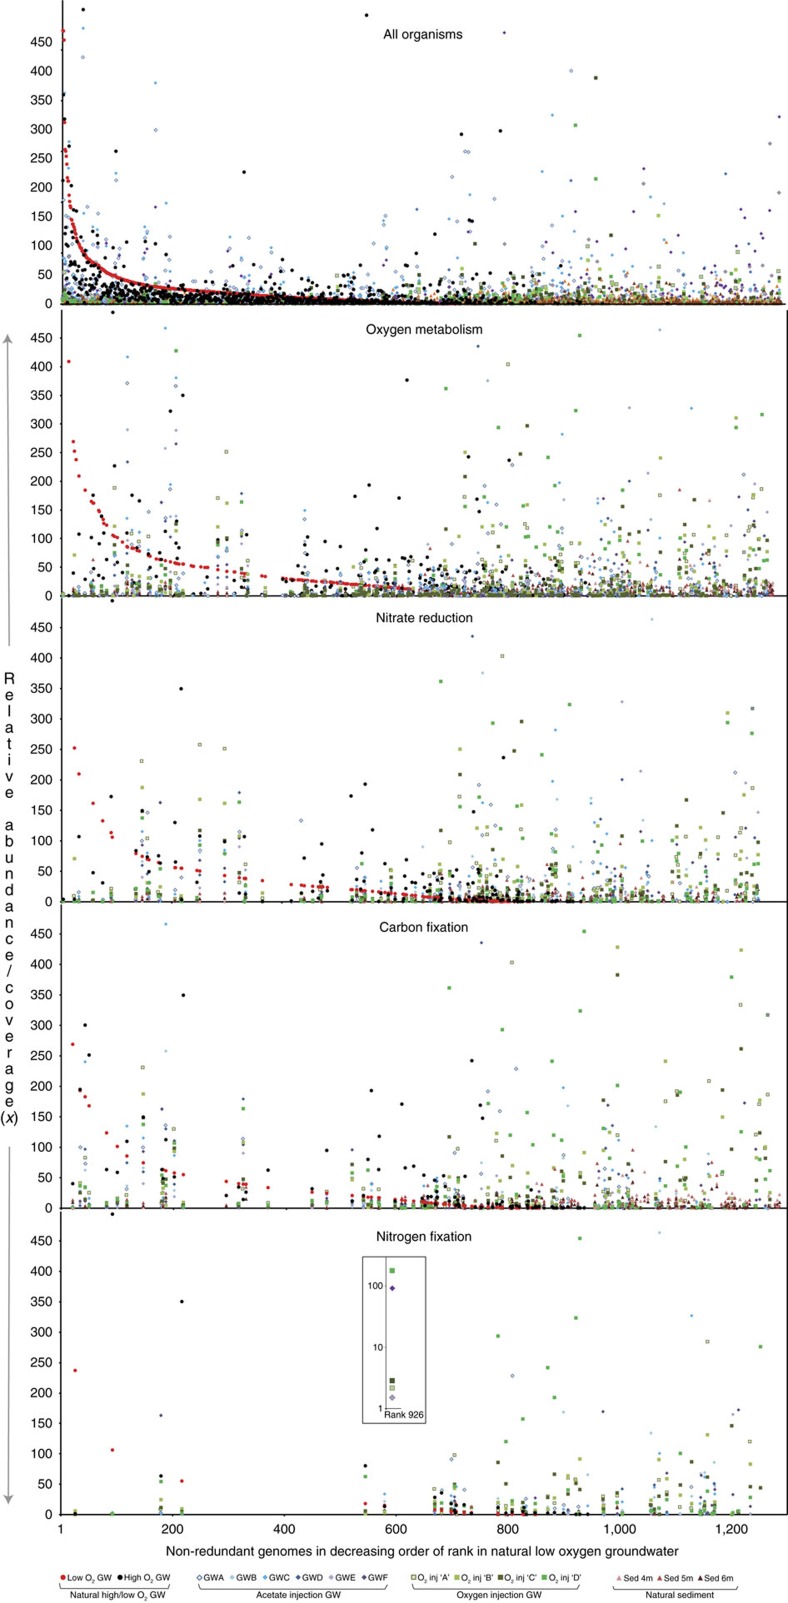
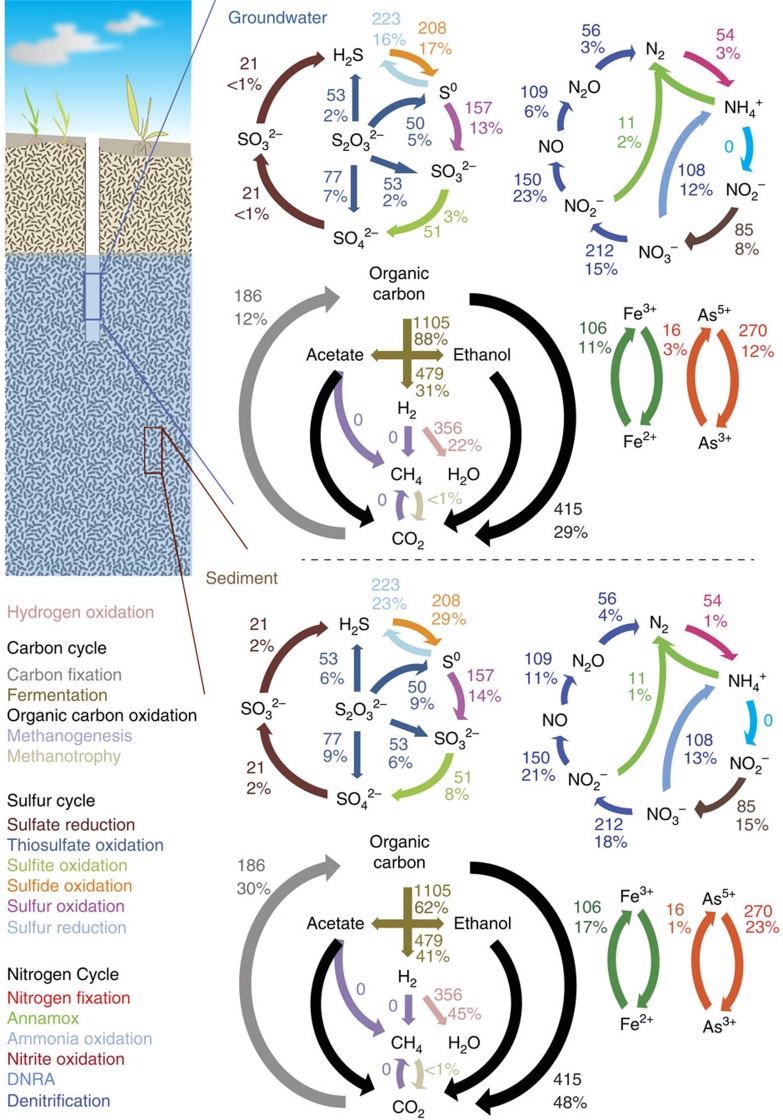
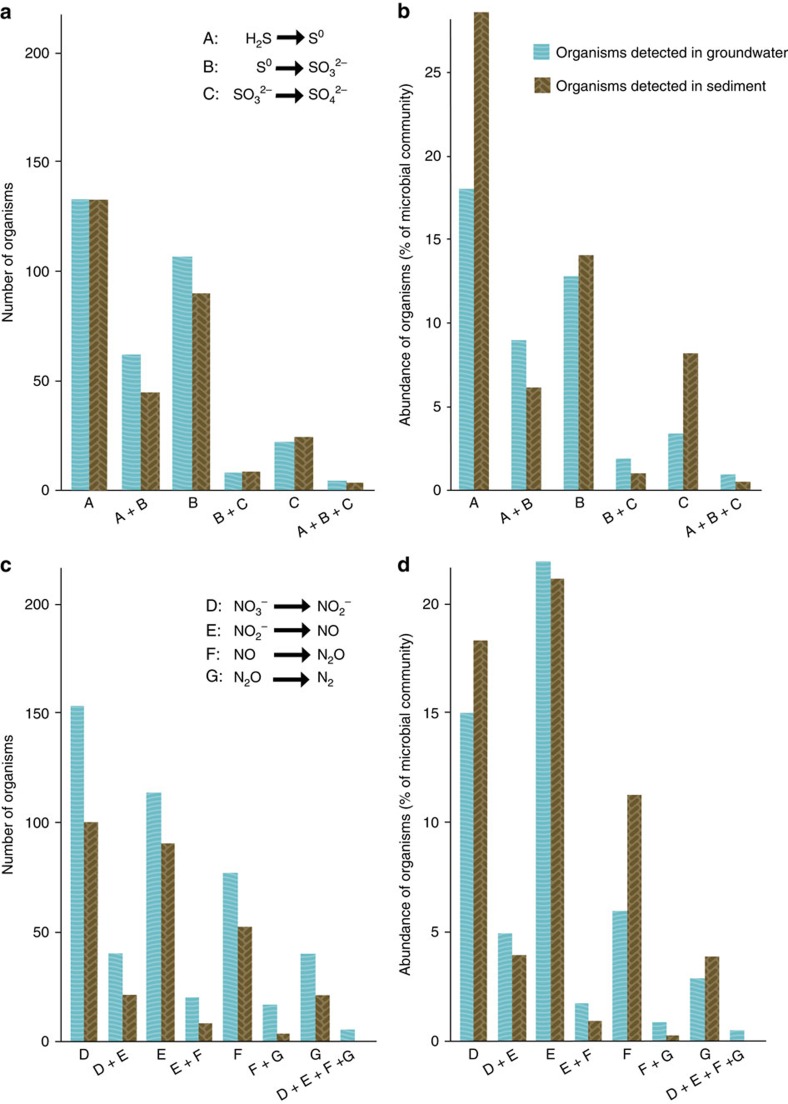
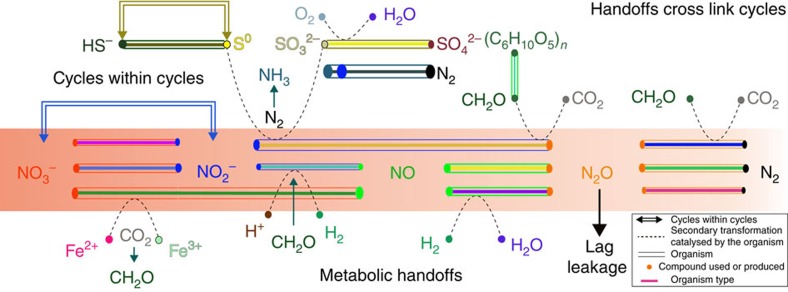
The subterranean world hosts up to one-fifth of all biomass, including microbial communities that drive transformations central to Earth's biogeochemical cycles. However, little is known about how complex microbial communities in such environments are structured, and how inter-organism interactions shape ecosystem function. Here we apply terabase-scale cultivation-independent metagenomics to aquifer sediments and groundwater, and reconstruct 2,540 draft-quality, near-complete and complete strain-resolved genomes that represent the majority of known bacterial phyla as well as 47 newly discovered phylum-level lineages. Metabolic analyses spanning this vast phylogenetic diversity and representing up to 36% of organisms detected in the system are used to document the distribution of pathways in coexisting organisms. Consistent with prior findings indicating metabolic handoffs in simple consortia, we find that few organisms within the community can conduct multiple sequential redox transformations. As environmental conditions change, different assemblages of organisms are selected for, altering linkages among the major biogeochemical cycles.


Figures

Figure 1
Figure 1. Sampling scheme for sediment and groundwater microbial communities from the Rifle Integrated Field Research site.
Samples were collected for metagenomics from sediment and groundwater spanning several redox transitions including natural unamended samples, and acetate and oxygen stimulation of groundwater microbial communities. Sediment samples were collected from depths of 4, 5 and 6 m below the surface. Groundwater was pumped from a depth of 5 m and filtered through serial 1.2, 0.2 and 0.1 μm filters. Groundwater samples were collected at six time points (A–F) during acetate stimulation, four time points during oxygen stimulation (A–D) and two time points representing naturally encountered high (high O2)- and low (low O2)-oxygen concentrations in the aquifer respectively. 1.2 μm filters from the acetate stimulation experiment were not sequenced.
Figure 2
Figure 2. Phylogeny of bacterial genomes inferred by maximum likelihood.
The phylogenetic tree is based on 16 concatenated RPs and was collapsed at the phylum level. Colours of the wedges indicate the following: black: phylum-level lineage identified at Rifle; blue: phylum-level lineage not identified at Rifle. Coloured circles describe important biogeochemical roles inferred for newly described phylum-level lineages. Proposed names for newly described phylum-level lineages (RIF1-RIF46 and SM2F11) are detailed in Table 1. The phylogenetic inference configurations with detailed branch support values are provided in Supplementary Fig. 2 and Supplementary Data 12.
Figure 3
Figure 3. Rank abundance plots highlighting organisms putatively involved in geochemical cycling across 15 different geochemical regimes in the aquifer.
Rank abundance curves were computed using whole-genome coverage estimated by read mapping. Organisms with genome coverage greater than 500x are not shown. Symbols represent different perturbations/sample sources: circles: natural high/low-oxygen groundwater; diamonds: acetate injection into groundwater; squares: oxygen injection into groundwater; triangles: natural unamended sediment. Y axis represents the normalized relative abundance in the community (genome coverage normalized to the natural low-oxygen groundwater sample). Panels representing specific metabolisms (oxygen metabolism, nitrate reduction, carbon fixation and nitrogen fixation) only show organisms inferred to have that capacity. Inset figure highlights the variation in abundance of a single Sulfuricurvum species (Sulfuricurvum sp. RIFOXYD12_FULL_44_77) that appears to be able to fix carbon and nitrogen, across the different geochemical conditions. GW, groundwater. For groundwater, only samples collected on the 0.2 μm filters are shown.
Figure 4
Figure 4. Biogeochemical cycling capacity inferred for the microbial communities in sediment and groundwater in the aquifer.
The cycles of C, N, S, H, Fe and As are described above. Colours represent different parts of the individual cycles. Arrows indicate specific transformations. Numbers and percentages on arrows indicate the number of organisms inferred to be able to perform the transformation, and their total relative abundance in the microbial community, respectively. For groundwater, only natural unamended samples collected on the 0.2 μm filter were considered. DNRA, dissimilatory nitrate reduction to ammonium.
Figure 5
Figure 5. Number and abundance of organisms putatively involved in sequential redox transformations.
(a,b) Number (a) and relative abundance (b) of organisms inferred to be involved in sequential oxidation of sulfide to sulfate. (c,d) Number (c) and relative abundance (d) of organisms putatively involved in sequential reduction of nitrate to N2 (denitrification). Only organisms detected at >0.01% of the microbial community were considered. For groundwater, only natural unamended samples collected on the 0.2 μm filter were considered. Organisms considered for step ‘E' (NO2→NO) might detoxify NO2.
Figure 6
Figure 6. Schematic diagram illustrating the concept of metabolic handoffs and some potential consequences.
Individual organisms are shown as rods. Resources inferred to be used or produced by an organism are indicated as coloured dots. Based on Supplementary Data 9, multiple organisms are potentially able to carry out specific steps, and some may be capable of more than one step. The red gradient indicates a pulse of nitrate introduced into the system. A ‘handoff' occurs when a compound produced by one organism is used by another. ‘Lag leakage' refers to the possibility that a compound moves out of the local environment (for example, N2O as a gas) because organisms that use it are not active at the time that its production was initiated. ‘Cycles within cycles' refers to the possibility of a sub-cycle occurring within a particular biogeochemical cycle.

Similar articles

Cited by

References

    1. McMahon S. & Parnell J. Weighing the deep continental biosphere. FEMS Microbiol. Ecol. 87, 113–120 (2014). - PubMed
    1. Kallmeyer J., Pockalny R., Adhikari R. R., Smith D. C. & D'Hondt S. Global distribution of microbial abundance and biomass in subseafloor sediment. Proc. Natl Acad. Sci. USA 109, 16213–16216 (2012). - PMC - PubMed
    1. Schloss P. D., Girard R. A., Martin T., Edwards J. & Thrash J. C. Status of the archaeal and bacterial census: an update. MBio 7, e00201–e00216 (2016). - PMC - PubMed
    1. Abreu N. A. et al.. Decoding molecular interactions in microbial communities. FEMS Microbiol. Rev. 1, 187–196 (2016). - PMC - PubMed
    1. Bosse M. et al.. Interaction networks for identifying coupled molecular processes in microbial communities. BioData Min. 8, 21 (2015). - PMC - PubMed

Publication types