. 2016 Oct 24:6:35854.
doi: 10.1038/srep35854.

Basal Tumor Cell Isolation and Patient-Derived Xenograft Engraftment Identify High-Risk Clinical Bladder Cancers

Affiliations

Basal Tumor Cell Isolation and Patient-Derived Xenograft Engraftment Identify High-Risk Clinical Bladder Cancers

K B Skowron et al. Sci Rep. .

Abstract

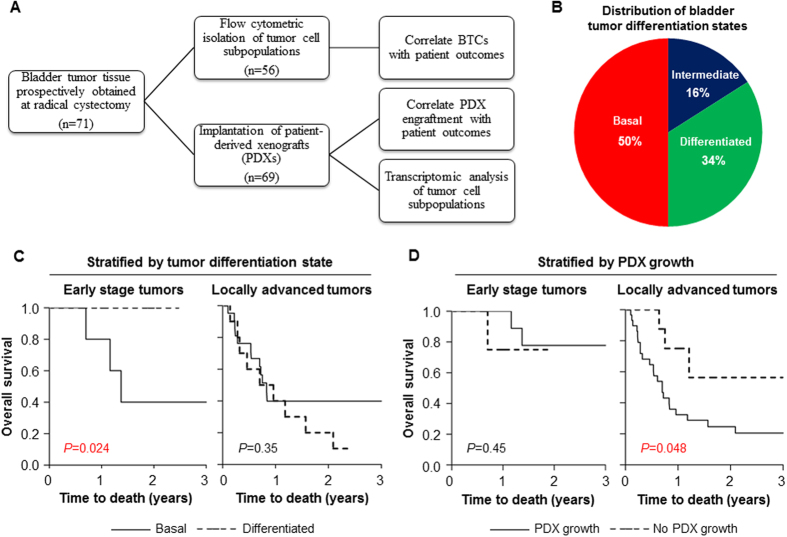
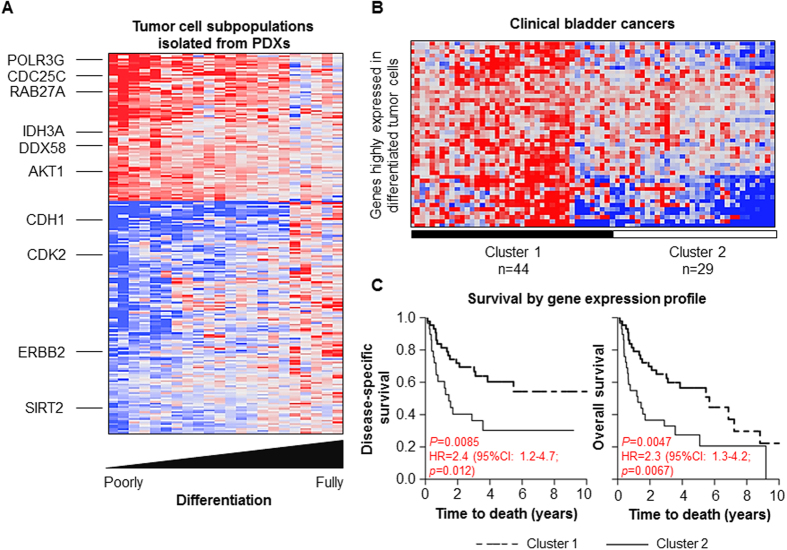
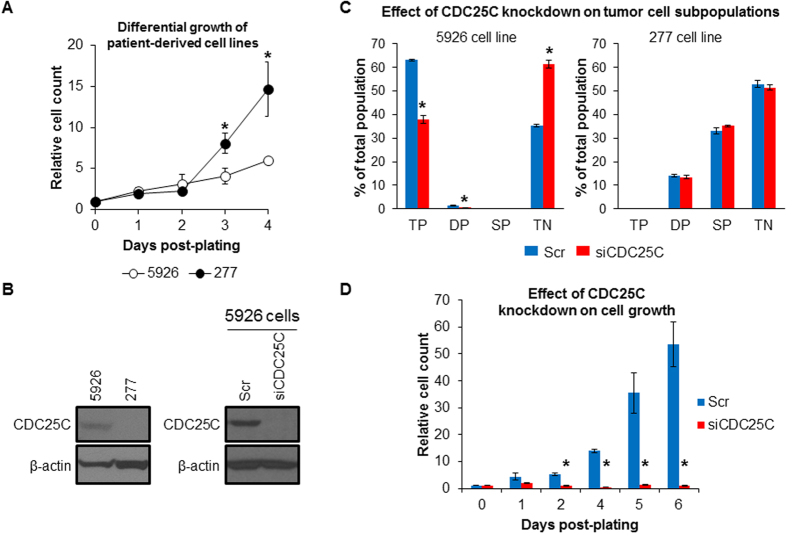
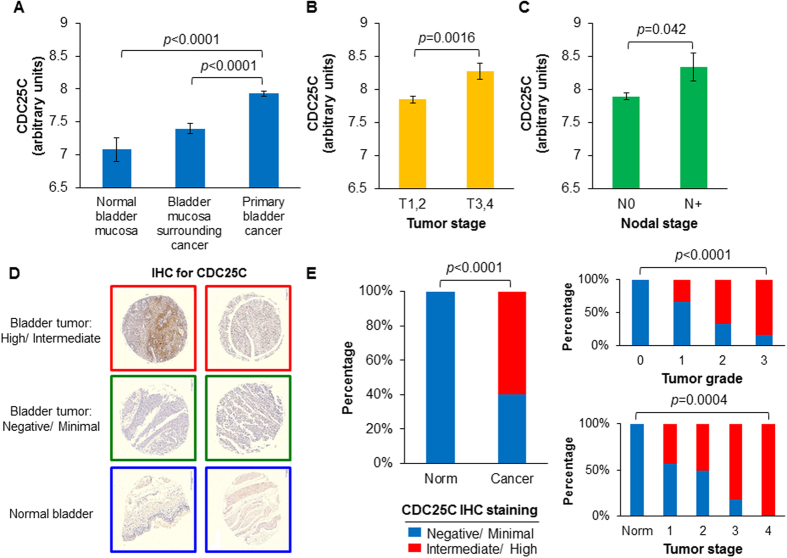
Strategies to identify tumors at highest risk for treatment failure are currently under investigation for patients with bladder cancer. We demonstrate that flow cytometric detection of poorly differentiated basal tumor cells (BTCs), as defined by the co-expression of CD90, CD44 and CD49f, directly from patients with early stage tumors (T1-T2 and N0) and patient-derived xenograft (PDX) engraftment in locally advanced tumors (T3-T4 or N+) predict poor prognosis in patients with bladder cancer. Comparative transcriptomic analysis of bladder tumor cells isolated from PDXs indicates unique patterns of gene expression during bladder tumor cell differentiation. We found cell division cycle 25C (CDC25C) overexpression in poorly differentiated BTCs and determined that CDC25C expression predicts adverse survival independent of standard clinical and pathologic features in bladder cancer patients. Taken together, our findings support the utility of BTCs and bladder cancer PDX models in the discovery of novel molecular targets and predictive biomarkers for personalizing oncology care for patients.


Figures

Figure 1
Figure 1. Prognostic value of basal tumor cell isolation and patient-derived xenograft engraftment in clinical bladder cancers.
(A) Schematic for prospective collection of patient-derived bladder cancers at the University of Chicago Medical Center. (B) Distribution of bladder tumor differentiation states (n = 56) based on flow cytometric isolation of basal or triple positive (CD90+/CD44+/CD49f+), intermediate or double positive (CD90−/CD44+/CD49f+) and differentiated or single positive (CD90−/CD44−/CD49f+) bladder tumor cells. (C) Kaplan-Meier curves comparing overall survival for patients with basal and differentiated tumors in early stage ([pathologic] pT1-T2 and N0 [lymph node-negative]; n = 15) and locally advanced (pT3-T4 or N + [lymph node-positive]; n = 33) tumors. (D) Kaplan-Meier curves comparing overall survival for patients stratified by PDX engraftment in early stage and locally advanced tumors. BTC, basal tumor cell. PDX, patient-derived xenograft. Time to death was calculated as the interval between radical cystectomy and date of death or last follow-up. P-values were determined using log-rank tests.
Figure 2
Figure 2. Gene signature associated with bladder tumor cell differentiation and poor prognosis in patients with bladder cancer.
(A) Heat map showing expression of 88 correlated and 136 anti-correlated genes associated with tumor cell differentiation. Five independent PDXs were flow sorted into respective tumor cell subpopulations and were available for microarray gene expression analyses. Red color indicates high expression, while blue color indicates low expression. (B) Hierarchical clustering of differentially expressed tumor cell differentiation-associated genes identified two groups of patients from the MD Anderson Cancer Center data set (C). Kaplan-Meier survival curves for patient clusters stratified by tumor cell differentiation-associated gene expression. Time to death was calculated as the interval between radical cystectomy and date of death or last follow-up. P-values were determined using log-rank tests. HR, hazard ratio; 95% CI, confidence interval; P-value determined using univariate Cox proportional hazard analysis.
Figure 3
Figure 3. CDC25C promotes tumor cell dedifferentiation and growth.
(A) Differential growth of 5926 (predominantly basal cells) and 277 (predominantly fully differentiated cells) cell lines in vitro. Cell count was manually determined using a hemocytometer for four biological replicates per sample. Relative cell count was determined by normalization to day 0 values. (B) Western blot analysis of CDC25C protein expression in parental 5926 and 277 cell lines and in 5926 cells after treatment with siRNA against CDC25C (siCDC25C) or a scrambled control (Scr). β-actin protein level served as a loading control. (C) Flow cytometric analysis of bladder tumor cell subpopulations after treatment of 5926 and 277 cells with siRNA against CDC25C or a scrambled control. TP, triple-positive (basal); DP, double-positive (intermediate); SP, single-positive (differentiated); TN, triple-negative (fully differentiated). (D) Effect of CDC25C gene suppression on 5926 cell growth. Relative cell count was determined by normalization to day 0 values. Error bars denote standard error of mean. P-values were determined using 2-tailed Student’s t-test. Asterisks denote P-values ≤ 0.05.
Figure 4
Figure 4. CDC25C overexpression is prognostic in clinical bladder cancers.
(A) CDC25C gene expression in clinical specimens derived from normal bladder mucosa (n = 10), bladder mucosa surrounding cancer (n = 58) and primary bladder cancers (n = 165). Gene expression values were estimated by normalized microarray signal intensity in the Chungbuk Cancer Center data set. CDC25C gene expression differences in early (T1-2, n = 135) vs. advanced (T3-4, n = 30) primary bladder cancers (B) and lymph node-negative (N0, n = 149) vs. lymph node-positive (N+, n = 15) bladder tumors (C). P-values were determined using 2-tailed Student’s t-test. (D) Representative immunohistochemical (IHC) staining for CDC25C in a bladder cancer tissue microarray demonstrating differences in staining intensity across bladder tumors and normal bladder. IHC staining was categorized as follows: “Negative” = rare positive cells, <5%; “Minimal” = <25% highly positive cells or majority of cells with <25% stained nucleus; “Intermediate”=25–75% highly positive cells or majority of cells with 25–75% stained nucleus; “High” = >75% highly positive cells. (E) Differences in intermediate/high CDC25C IHC staining in comparisons of normal bladder mucosa (Norm, n = 10) and primary bladder tumors (Cancer, n = 40) [Left] and by tumor grade [Right, top] and overall tumor stage [Right, bottom]. P-value determined using χ2 tests.

References

    1. Siegel R. L., Miller K. D. & Jemal A.. Cancer statistics, 2016: Cancer Statistics, 2016. CA. Cancer J. Clin. 66, 7–30 (2016). - PubMed
    1. Shah J. B., McConkey D. J. & Dinney C. P. N.. New strategies in muscle-invasive bladder cancer: on the road to personalized medicine. Clin. Cancer Res. 17, 2608–2612 (2011). - PubMed
    1. Advanced Bladder Cancer (ABC) Meta-analysis Collaboration. Neoadjuvant chemotherapy in invasive bladder cancer: update of a systematic review and meta-analysis of individual patient data advanced bladder cancer (ABC) meta-analysis collaboration. Eur. Urol. 48, 202–205; discussion 205–206 (2005). - PubMed
    1. Grossman H. B. et al.. Neoadjuvant chemotherapy plus cystectomy compared with cystectomy alone for locally advanced bladder cancer. N. Engl. J. Med. 349, 859–866 (2003). - PubMed
    1. Galsky M. D. et al.. Effectiveness of Adjuvant Chemotherapy for Locally Advanced Bladder Cancer. J. Clin. Oncol. 34, 825–832 (2016). - PubMed

Publication types

MeSH terms