. 2017 Mar;36(10):1384-1393.
doi: 10.1038/onc.2016.303. Epub 2016 Oct 24.

Multiplatform-based molecular subtypes of non-small-cell lung cancer

Affiliations

Multiplatform-based molecular subtypes of non-small-cell lung cancer

F Chen et al. Oncogene. 2017 Mar.

Abstract

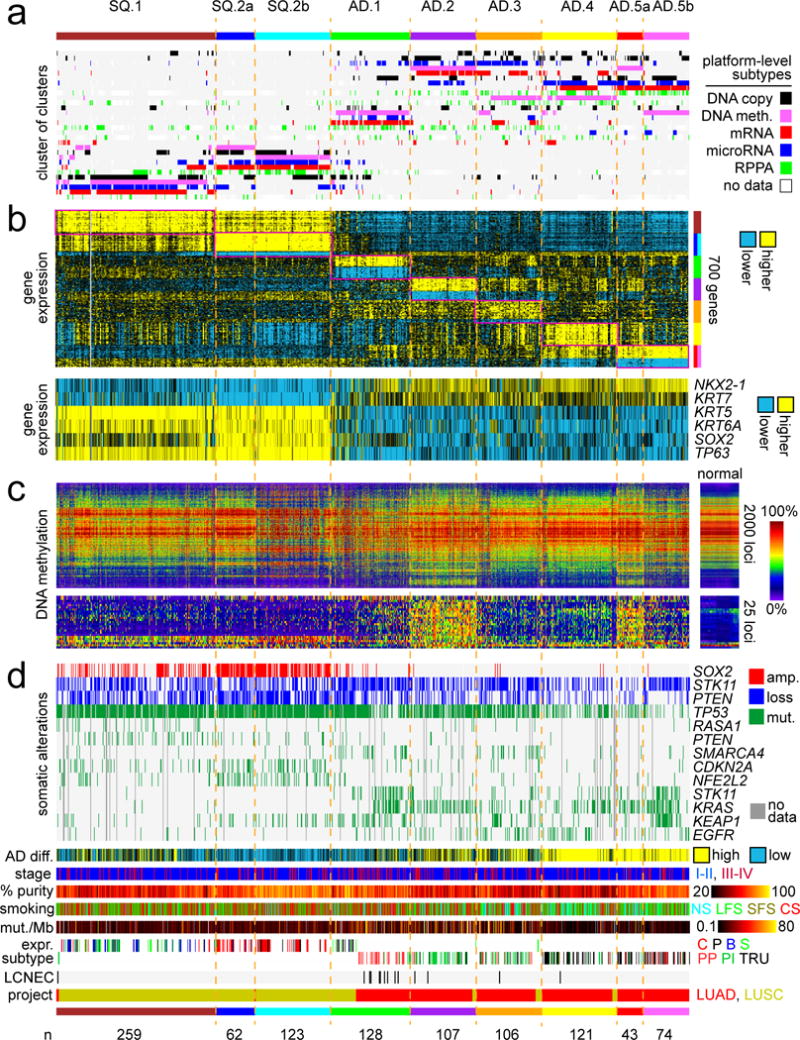
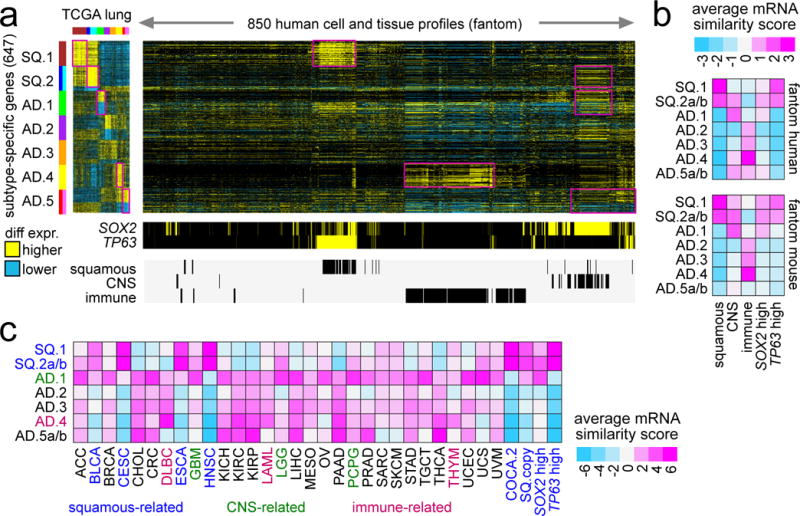
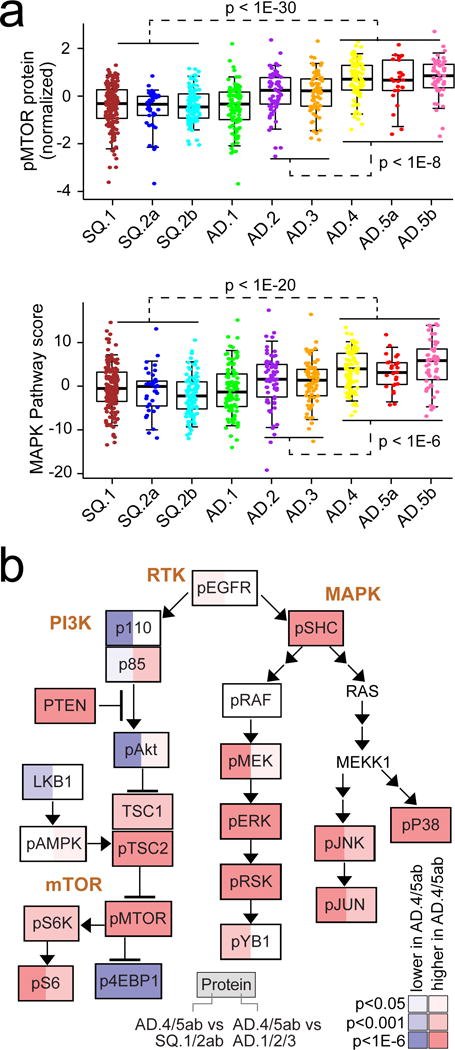
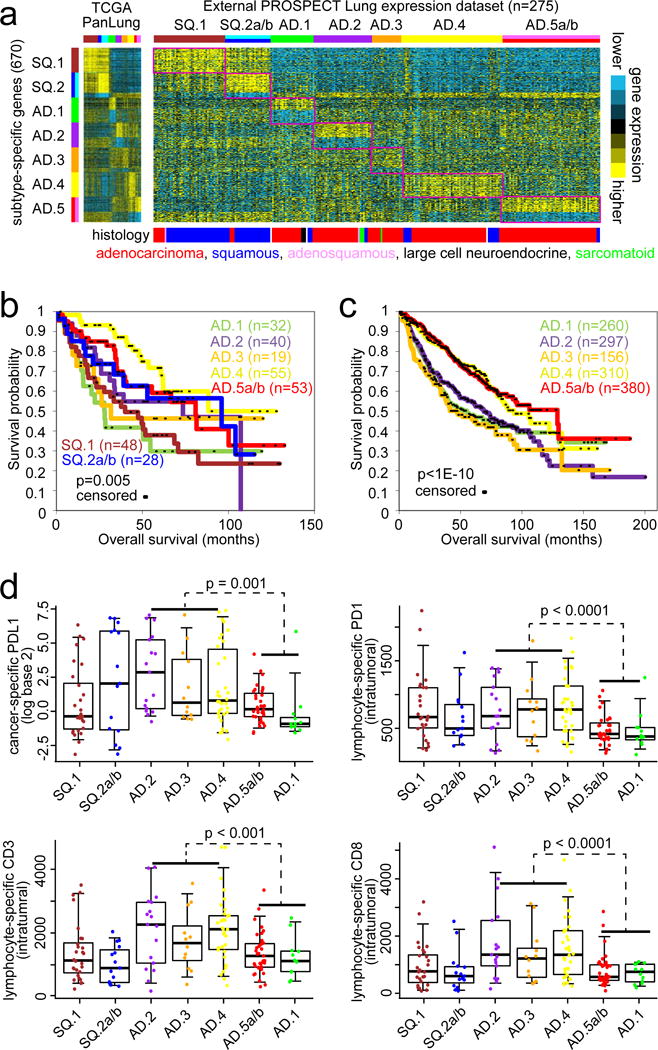
Non-small-cell lung cancer (NSCLC) demonstrates remarkable molecular diversity. With the completion of The Cancer Genome Atlas (TCGA), there is opportunity for systematic analyses of the entire TCGA NSCLC cohort, including comparisons and contrasts between different disease subsets. On the basis of multidimensional and comprehensive molecular characterization (including DNA methylation and copy, and RNA and protein expression), 1023 NSCLC cases-519 from TCGA adenocarcinoma (AD) project and 504 from TCGA squamous cell carcinoma (SQCC) project-were classified using a 'cluster-of-clusters' analytic approach. Patterns from TCGA NSCLC subsets were examined in independent external databases, including the PROSPECT (Profiling of Resistance patterns and Oncogenic Signaling Pathways in Evaluation of Cancers of the Thorax) NSCLC data set. Nine genomic subtypes of NSCLC were identified, three within SQCC and six within AD. SQCC subtypes were associated with transcriptional targets of SOX2 or p63. One predominately AD subtype (with a large proportion of SQCC) shared molecular features with neuroendocrine tumors. Two AD subtypes manifested a CpG island methylator phenotype. Three AD subtypes showed high p38 and mTOR pathway activation. AD subtypes associated with low differentiation showed relatively worse prognosis. SQCC subtypes and two of the AD subtypes expressed cancer testis antigen genes, whereas three AD subtypes expressed several immune checkpoint genes including PDL1 and PDL2, corresponding with patterns of greater immune cell infiltration. Subtype associations for several immune-related markers-including PD1, PDL1, CD3 and CD8-were confirmed in the PROSPECT cohort using immunohistochemistry. NSCLC molecular subtypes have therapeutic implications and lend support to a personalized approach to NSCLC management based on molecular characterization.


Conflict of interest statement

Competing Financial Interests statement: The authors have no competing interests.

Figures

Figure 1
Figure 1. Genomic subtypes of NSCLC in TCGA cohort by analysis of multiple data platforms
(a) Integration of subtype classifications from five “omic” data platforms identified nine major lung cancer groups represented in TCGA (n=1023 cases). Three of these subtypes—SQ.1, SQ.2a, SQ.2b—are enriched for lung Squamous Cell Carcinoma (SQCC) cases; five other subtypes—AD.1, AD.2, AD.3, AD.4, AD.5a, AD.5b—are enriched for lung Adenocarcinoma (AD) cases. The heat map displays the subtypes defined independently by DNA methylation (pink), Chromosomal copy alteration (black), mRNA expression (red), microRNA expression (blue), and protein (RPPA) expression (green); each row in this heat map denotes membership within a specific subtype defined by the indicated platform. (b) Differential gene expression patterns, with the first heat map representing a set of genes that help to distinguish between the nine subtypes (for each subtype, showing the top 100 genes most differentially in the given subtype versus the rest of the tumors, with SQ.2a and SQ.2b showing homogeneous global expression patterns but differing methylation patterns, as is also the case with AD.5a and AD.5b), and with the second heat map representing well-established markers distinguishing lung SQCC from lung AD. (c) DNA methylation patterns, with the first heat map representing the top 2000 genomic loci with the highest variability in DNA methylation patterns across tumors, and with the second heat map representing probes in CpG island promoter regions used previously to identify CIMP lung AD cases. (d) Specific copy number and nonsilent somatic mutation features, transcriptional signature of high AD differentiation, patient stage, estimated tumor sample purity, patient smoking status (NS, lifelong never-smokers; LFS, longer-term former smokers greater than 15 years; SFS, shorter-term former smokers; CS, current smokers), mutation rate, mRNA expression-based subtype, (LUSC: C, classical; P, primitive; B, basal; S, secretory; LUAD: PP, Proximal proliferative; PI, Proximal inflammatory; TRU, Terminal respiratory unit), LCNEC (large cell neuroendocrine carcinoma) cases, and TCGA project designation. See also Figures S1 and S2 and Tables S1 and S2.
Figure 2
Figure 2. Gene signatures distinguishing NSCLC genomic subtypes are manifested in specific tissue types or pan-cancer subsets
(a) The top set of 700 mRNAs distinguishing between NSCLC genomic subtypes (from Figure 1b) were examined in the Fantom consortium expression dataset of various cell types or tissues from human specimens (n=889 profiles). For these 700 mRNAs, the corresponding differential patterns within NSCLC are shown off to the left. Regions sharing similarity with one or more NSCLC subtype-specific signatures are highlighted. Membership of the Fantom profiles in general categories of “immune” (immune cell types or blood or related tissues), “CNS” (related to central nervous system including brain), or “squamous” (including bronchial, trachea, oral regions, throat and esophagus regions, nasal regions, urothelial, cervix, sebocyte, keratin/skin/epidermis) is indicated. (b) Average expression similarity correlation (Pearson’s t-statistic, based on genes in part a; pink, positive or similar; blue, negative or dissimilar) between NSCLC molecular subtypes (rows) and fantom cell types or tissues in selected categories (columns). Results shown for both fantom human and fantom mouse datasets. (c) Average expression similarity correlation (Pearson’s t-statistic, based on genes in part a) between NSCLC molecular subtypes (rows) and non-lung cancer types in TCGA. Cancer type denoted by TCGA project designation (BLCA, bladder; CESC, cervical; DLBC, diffuse large B-cell lymphoma; ESCA, esophageal; GBM, glioblastoma; HNSC, head and neck; LAML, leukemia; LGG, lower grade glioma; PCPG, pheochromocytoma and paraganglioma; THYM, thymoma). COCA.2 and SQ.copy, associated with “squamous” pan-cancer subtype by Hoadley et al.. See also Figures S3 and S4.
Figure 3
Figure 3. Differential activity of PI3K/AKT/MTOR and MAPK pathways across NSCLC genomic subtypes
(a) Differential phospho-mTOR (top) and MAP Kinase protein signaling (bottom) among subtypes (by RPPA, average of phospho-SHC or pSHC, pRAF, pMEK, pERK, pSRK, pYB1, pP38, pJNK, and pJUN). P-values for indicated comparisons by t-test on log-transformed data. Box plots represent 5%, 25%, 50%, 75%, and 95%. (b) Diagram of PI3K/AKT/MTOR and MAPK pathways, with differential protein expression patterns represented, comparing tumors in groups AD.4, AD.5a, or AD.5b with tumors in groups SQ.1, SQ.2a, or SQ.2b (red, significantly higher in AD.4/5ab). P-values by t-test on log-transformed data. See also Figure S5.
Figure 4
Figure 4. Immune checkpoint-related differences across NSCLC genomic subtypes
(a) Heat maps of differential expression, for genes encoding immunotherapeutic targets (top panels) and for gene expression-based signatures of immune cell infiltrates (bottom panels), across TCGA lung cancers, normal adjacent lung samples, kidney clear cell cases (KIRC), melanoma cases (SKCM), and cases from selected other cancer types (THCA, thyroid; BRCA, breast; HNSC, head and neck; PRAD, prostate; CRC, colorectal; BLCA, bladder; OV, ovarian; LIHC, liver; LGG, lower grade glioma; GBM, glioblastoma). TREG cells, regulatory T cells; TGD cells, T gamma delta cells; Tcm cells, T central memory cells; Tem cells, T effector memory cells; Tfh cells, T follicular helper cells; NK cells, natural killer cells; DC, dendritic cells; iDC, immature DCs; aDC, activated DCs; P-DC, plasmacytoid DCs; APM1/APM2, antigen presentation on MHC class I/class II, respectively. Neoepitope count per NSCLC sample is also indicated. (b) Differential mRNA expression of T cell-associated signature (left) and immune checkpoint target PDCD1 (PD1, right, normalized values) among the NSCLC genomic subtypes, normal adjacent lung tissue, and non-lung cancer types. Box plot represents 5%, 25%, 50%, 75%, and 95%. P-values for indicated comparisons by t-test. (c) Diagram of immune checkpoint pathway (featuring interactions between T cells and antigen-presenting cells, including tumor cells), with differential expression patterns represented, comparing tumors in groups AD.2, AD.3, or AD.4 with tumors in groups AD.1, AD.5a, or AD.5b (red, significantly higher in AD.2/3/4). P-values by t-test. (d) Diagram of immune checkpoint pathway, comparing tumors in groups AD.2, AD.4, AD.5a, or AD.5b with tumors in groups SQ.1, SQ.2a, or SQ.2b (red, significantly higher in SQ.1/SQ.2a/SQ.2b). P-values by t-test. See also Figure S6.
Figure 5
Figure 5. Observation of patterns associated with TCGA NSCLC genomic subsets in external NSCLC molecular datasets
(a) Gene expression profiles in the PROSPECT NSCLC cohort (n=247 cases) were classified according to TCGA NSCLC genomic subtype. Expression patterns for the top set of 700 mRNAs distinguishing between the seven COCA-based TCGA NSCLC genomic subtypes (from Figure 1b) are shown for both TCGA and PROSPECT datasets. Regions in the PROSPECT sample profiles sharing similarity with TCGA lung subtype-specific signature pattern are highlighted. (b,c) Associated differences in patient overall survival among TCGA-associated genomic subtypes, in PROSPECT cohort (part b) and in an external “compendium” dataset (part c) of 11 published expression profiling datasets for human lung AD (right, n=1403 cases). P-values by Log-rank test. (d) Differential patterns by genomic subtype for several immune-related markers—including cancer-specific PDL1 (top left), lymphocyte-specific and intratumoral PD1 (top right), lymphocyte-specific and intratumoral CD3 (bottom left), and lymphocyte-specific and intratumoral CD8 (bottom right)—were examined in the PROSPECT cohort using immunohistochemistry methods (n=153 cases, 110 AD and 43 SQCC), which could distinguish cancer-specific from lymphocyte-specific expression patterns within their respective tumor compartments. Box plots represent 5%, 25%, 50%, 75%, and 95%. P-values by Mann-Whitney U-test comparing AD.2/AD.3/AD.4 tumors with AD.1/AD.5a/AD.5b tumors. See also Figures S7 and S8 and S9.

References

    1. Chen Z, Fillmore C, Hammerman P, Kim C, Wong K. Non-small-cell lung cancers: a heterogeneous set of diseases. Nat Rev Cancer. 2014;14:535–546. - PMC - PubMed
    1. Thomas A, Liu S, Subramaniam D, Giaccone G. Refining the treatment of NSCLC according to histological and molecular subtypes. Nat Rev Clin Oncol. 2015;12:511–526. - PubMed
    1. Garber M, Troyanskaya O, Schluens K, Petersen S, Thaesler Z, Pacyna-Gengelbach M, et al. Diversity of gene expression in adenocarcinoma of the lung. Proc Natl Acad Sci U S A. 2001;98:13784–13789. - PMC - PubMed
    1. Beer DG, Kardia SL, Huang CC, Giordano TJ, Levin AM, Misek DE, et al. Gene-expression profiles predict survival of patients with lung adenocarcinoma. Nat Med. 2002;8:816–824. - PubMed
    1. Wilkerson M, Yin X, Hoadley K, Liu Y, Hayward M, Cabanski C, et al. Lung squamous cell carcinoma mRNA expression subtypes are reproducible, clinically important, and correspond to normal cell types. Clin Cancer Res. 2010;16:4864–4875. - PMC - PubMed

MeSH terms

Substances