. 2017 Feb 2;36(5):606-617.
doi: 10.1038/onc.2016.235. Epub 2016 Oct 24.

CD133+ brain tumor-initiating cells are dependent on STAT3 signaling to drive medulloblastoma recurrence

Affiliations

CD133+ brain tumor-initiating cells are dependent on STAT3 signaling to drive medulloblastoma recurrence

N Garg et al. Oncogene. .

Abstract

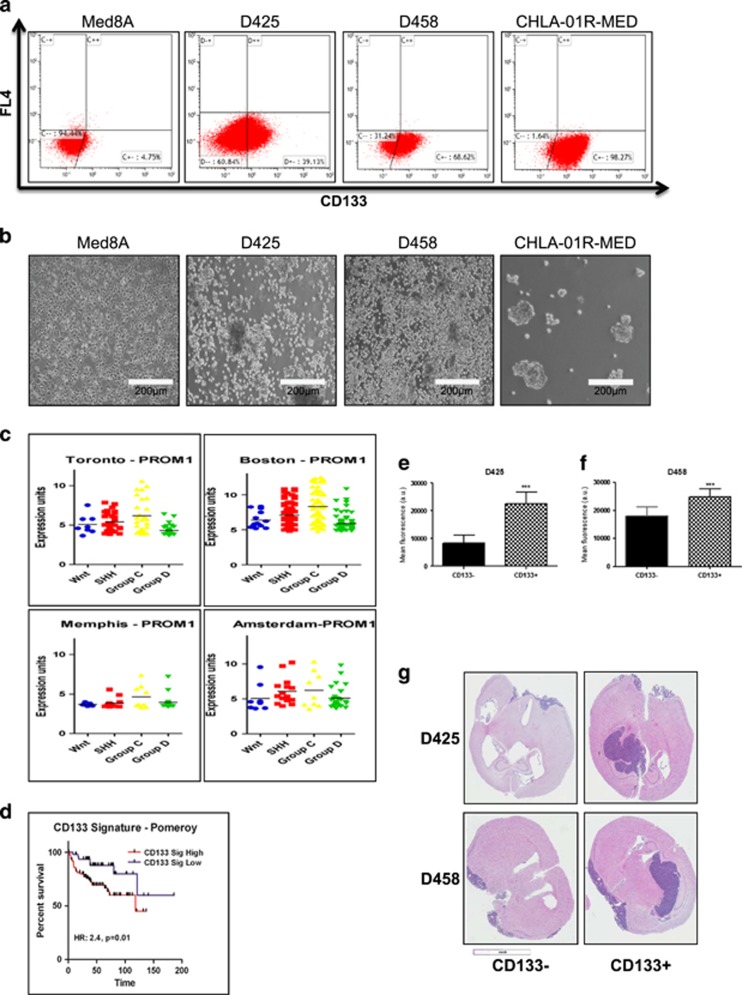
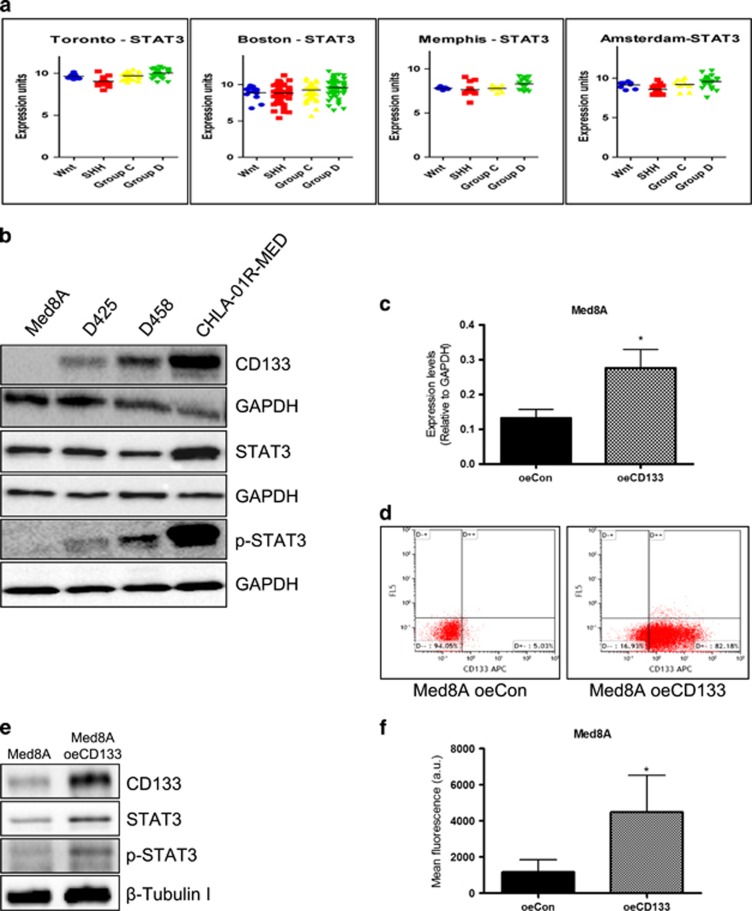
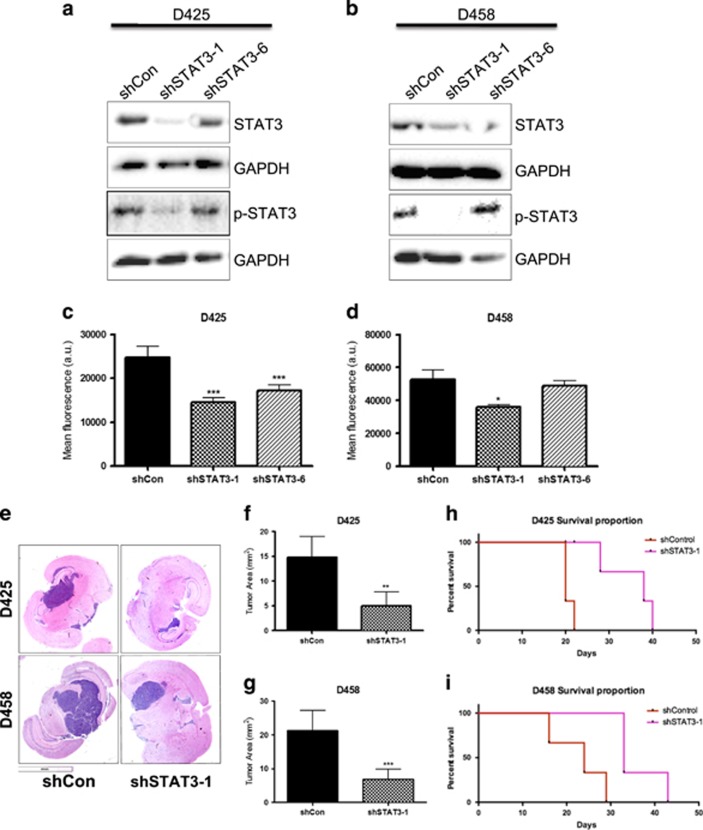
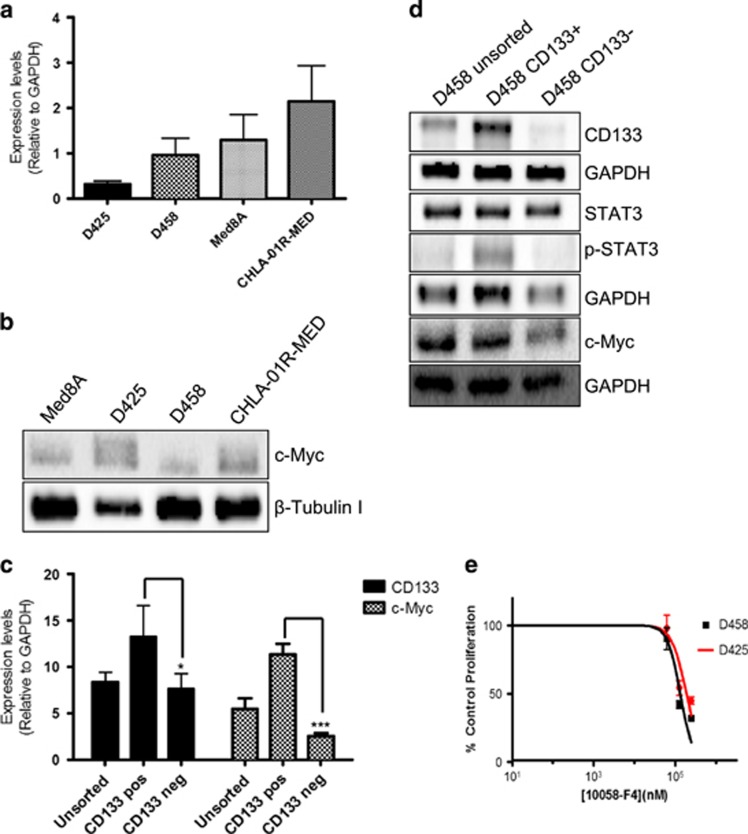
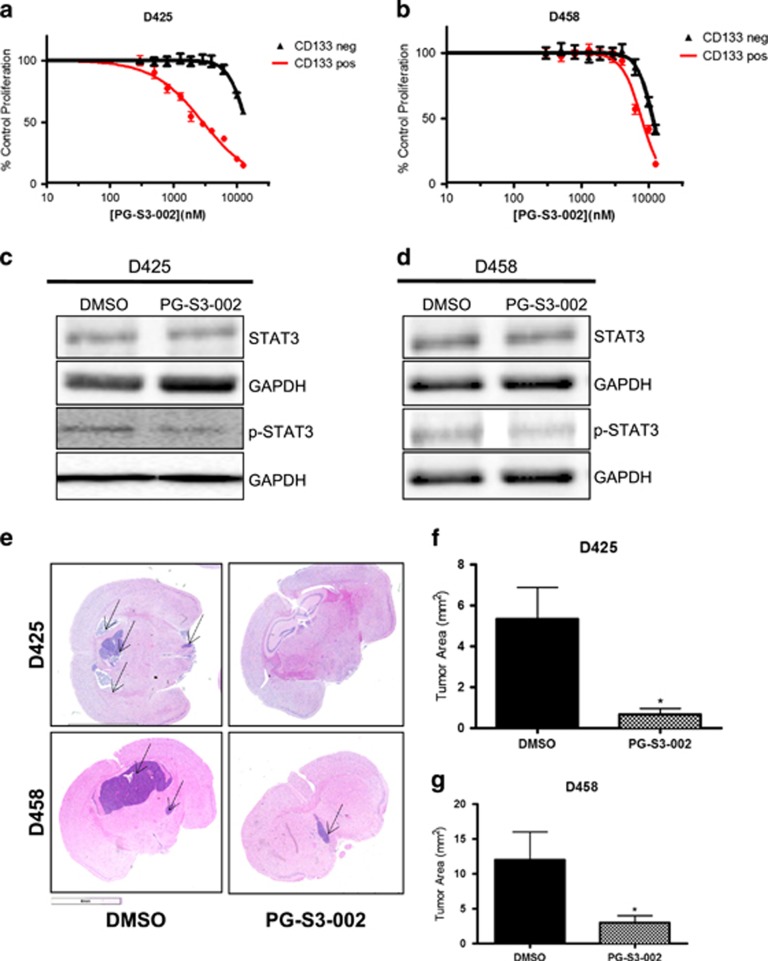
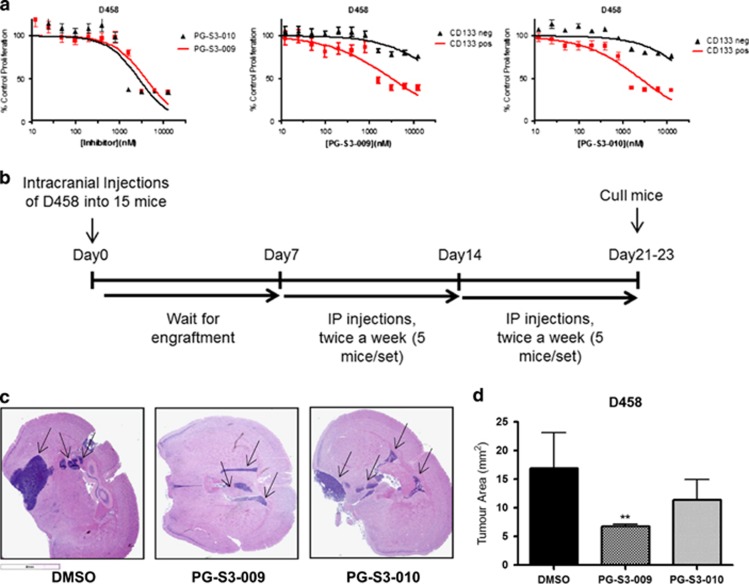
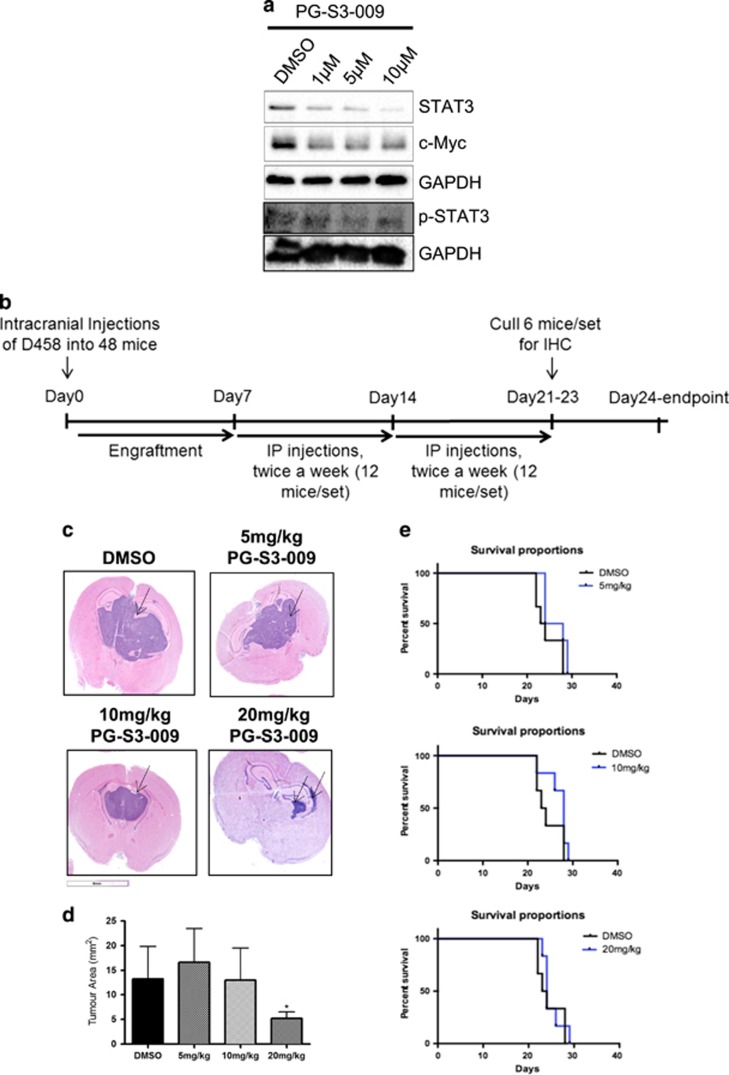
Medulloblastoma (MB), the most common malignant paediatric brain tumor, is currently treated using a combination of surgery, craniospinal radiotherapy and chemotherapy. Owing to MB stem cells (MBSCs), a subset of MB patients remains untreatable despite standard therapy. CD133 is used to identify MBSCs although its functional role in tumorigenesis has yet to be determined. In this work, we showed enrichment of CD133 in Group 3 MB is associated with increased rate of metastasis and poor clinical outcome. The signal transducers and activators of transcription-3 (STAT3) pathway are selectively activated in CD133+ MBSCs and promote tumorigenesis through regulation of c-MYC, a key genetic driver of Group 3 MB. We screened compound libraries for STAT3 inhibitors and treatment with the selected STAT3 inhibitors resulted in tumor size reduction in vivo. We propose that inhibition of STAT3 signaling in MBSCs may represent a potential therapeutic strategy to treat patients with recurrent MB.


Conflict of interest statement

The authors declare no conflict of interest.

Figures

Figure 1
Figure 1
CD133 characterizes group 3 MB and CD133+ cells show increased tumorigenicty and proliferation as compared with CD133 populations: MB cell lines are grown in their respective media conditions as described in the ‘Materials and methods’ section. (a) Representative flow cytometry plots exhibiting percentage of CD133 protein levels in Med8A (4.75%), D425 (39.13%), D458 (68.62%) and CHLA-01R-MED (98.27%). (b) Phase-contrast pictures of the above cell lines showing difference in their morphology and growth patterns. (c) CD133 expression identifies Group 3 MB (indicated as Group C) that was probed using affymetrix exon array data and expression levels represented by log2–transformed intensity signal. Four independent databases were probed to measure CD133 expression levels. (d) The CD133 signature was originally identified and described by Venupogal et al.(55) and CD133 signature genes are included as Supplementary Table 2. CD133-high signature reflects a reduced overall survival of MB patients compared with CD133-low tumors (hazard ratio=2.4, P=0.01). (e and f) Group 3 MB cells D425 and D458 were flow cytometrically sorted into CD133+ and CD133 populations and Presto Blue Assay assessed their proliferative potential. CD133+ cells are more proliferative when compared with CD133 cells. Bar represents mean fluorescence intensity (arbitrary units (a.u.)) of three technical replicates, mean±s.d., two-tailed t-test, P⩽0.0007 (g) 500 000 cells of each of CD133+ and CD133 populations were xenografted intracranially in mice brains. CD133+ cells generated larger and infiltrative tumors than CD133 cells (scale bar=4 mm).
Figure 2
Figure 2
STAT3 marks non-Shh/Wnt MB and its expression parallels CD133 expression. (a) affymetrix exon data from four independent databases shows STAT3 expression enriched in non-Shh/Wnt MB, that is, enrichment in Group 3 and Group 4 tumors (indicated as Group C and Group D respectively). Expression units are in log2 scale. (b) Immunoblot analysis for CD133, STAT3, activated STAT3 (p-STAT3) was performed in Group 3 and Group 2 MB lines. GAPDH was used as a loading control. To verify correlation between CD133 and STAT3, CD133 is overexpressed in Med8A. CD133 (c) transcript by qRT-PCR and (d) protein levels as shown by flow cytometric analysis (percentage increase from 5.03% to 82.18%, representative flow) are significantly increased following overexpression of CD133 (oe CD133). (e) Med8A oe CD133 showed increased p-STAT3, although no change in STAT3 was seen. (f) Proliferative capacity measured using Presto Blue assay shows OE CD133 cells have a significant increase in proliferation when compared with OE con (control cells). Bar represents mean fluorescence intensity (arbitrary units (a.u.)) of three technical replicates, mean±s.d., two-tailed t-test. *P<0.05.
Figure 3
Figure 3
STAT3 knockdown using lentiviral approach reveals its role in proliferation and tumor formation. shSTAT3 lentiviral vector-mediated transduction shows reduction in both STAT3 and phosphorylated p-STAT3 protein levels as assessed by immunoblotting with shSTAT3-1 vector compared with shControl vector in both (a) D425 and (b) D458 cell lines. GAPDH was used as a loading control. Proliferative capacity as determined by Presto Blue assay shows decreased proliferation in shSTAT3-1 (c and d) when compared with shControl-transduced cells. Bar represents mean fluorescence intensity (arbitrary units (a.u.)) of three technical replicates, mean±s.d., two-tailed t-test. *P⩽0.01. (e) Xenografts were generated using 100 000 cells of shControl or shSTAT3-1 vectors in D425 (upper panel) and D458 (lower panel) into the frontal lobes of NOD-SCID mice (n=6 in each group). shSTAT3-1-treated cells displayed significantly small and less invasive tumors in both lines (arrows indicates tumor area). Mice were killed in pairs of shControl and shSTAT3-1 when one member of the pair reached end point and H&E sections of the brains are shown. (f and g) Total area of tumor was calculated using ImageJ64 software (NIH, Bethesda, MA, USA). Bar represents tumor area (mm2) of n=6 mice in each group, mean±s.d. and two-tailed t-test. *P⩽0.005. (h and i) shSTAT3 cells xenograted mice maintain a significant survival over shControl-treated mice (n=3 in each group). The median survival in case of D425 shSTAT3 mice increased to 38 days compared with 20 days in shControl mice (P=0.0072) and median survival in D458 shSTAT3 mice augmented to 33 days from 24 days in shControl mice (P=0.04).
Figure 4
Figure 4
CD133, STAT3 and c-MYC constitute a signaling axis in MBSC regulation. (a) transcript by qRT-PCR and (b) protein levels as shown by western blotting. Bar represents expression levels relative to GAPDH of three technical replicates, mean±s.d., one-way analysis of variance, P⩽0.004. D458 cells were flow cytometry sorted for CD133+ and CD133 populations. c-MYC (c) transcript by qRT-PCR and (d) protein levels in D458 as shown by western blotting are significantly increased in CD133-positive cells when compared with CD133-negative cells. CD133+ cells also showed increased protein expression of CD133 and p-STAT3 relative to GAPDH control as analyzed by western blotting. Bar represent expression levels relative to GAPDH of three technical replicates, mean±s.d., two-way analysis of variance, P=0.005. (e) D425 and D458 cells were treated with c-MYC inhibitor 10058-F4 and IC50 curves were generated from inhibition of cell proliferation using Presto Blue assay with four technical replicates. IC50 values are: D425: 189.148 μM and D458: 133.277 μM.
Figure 5
Figure 5
STAT3 inhibitors targeting MBSCs. (a) D425 and (b) D458 cells were flow cytometry sorted into CD133+/− populations and treated with PG-S3-002 STAT3 inhibitor. IC50 curves were generated from inhibition of cell proliferation using presto blue assay with four technical replicates. For D425, IC50 values are; CD133+: 2917 nM and CD133: 13 794 nM. IC50 values for D458 are CD133+: 7807 nM and CD133: 11 424 nM. (c and d) Western blot showing protein levels of STAT3 and phosphorylated STAT3 (p-STAT3) in DMSO-treated and PG-S3-002-treated (IC80) D425 and D458, relative to GAPDH control. (e) D425 (upper panel) and D458 (lower panel) cells were treated ex vivo with their respective IC80 of PG-S3-002 for 4 days and 100 000 viable cells were injected into frontal lobes of NOD-SCID mice (n=3 in each group). Cells treated with DMSO were used as control. Mice were killed in pairs as they fell sick. H&E sections of the brains are shown. Average tumor size reduction is 85% in (f) D425 and 70% in (g) D458. Tumor area was calculated using ImageJ64 software (NIH). Bar represents tumor area (mm2) of n=3 mice in each group, mean±s.d. and two-tailed t-test. *P⩽0.005.
Figure 6
Figure 6
In vivo treatment with STAT3 inhibitors in recurrent MB cells. (a) unsorted D458 cells were treated with STAT3 inhibitors PG-S3-009 and PG-S3-010 and IC50 curves generated from inhibition of cell proliferation using Presto Blue assay with four technical replicates. For middle and right panels, D458 cell are sorted by flow cytometry into CD133+ and CD133 populations and then IC50 curves were generated. Left panel: IC50 values for PG-S3-009 and PG-S3-010 are 3943 nM and 2747 nM for total population, respectively. Middle panel: after treatment with PG-S3-009, sorted cells have IC50 values 3254 nM and 44 232 nM for CD133+ and CD133 population, respectively. Right panel: after PG-S3-010 treatment, IC50 values were 2517 nM and 39 511 nM for CD133+ and CD133 and populations, respectively. (b) Timeline of the in vivo treatment protocol. Day 0 is the first day of tumor implantation in mice (n=15 mice). D458 recurrent MB cells are used. After a week of implantation, treatment protocol of 20 mg/kg body weight of DMSO, PG-S3-009 or PG-S3-010 (n=5 mice in each set) started with intraperitoneal injections twice a week for 2 weeks. At the end of 2 weeks, mice were killed and their brains were harvested. (c) Representative H&E sections of the brains are shown (n=5). (d) Tumor area was calculated using ImageJ64 software (NIH). Bar represents tumor area (mm2) of n=5 mice in each group, mean±s.d. and two-tailed t-test. *P⩽0.005. Average tumor size reduction is 80% in treatment with PG-S3-009 and 35% in PG-S3-010.
Figure 7
Figure 7
Dose-dependence study of PG-S3-009. (a) Western blot showing c-MYC, STAT3 and p-STAT3 levels compared to GAPDH after treatment of D458 with serially increasing concentration of PG-S3-009. (b) Timeline of the in vivo protocol starting with 48 mice intracranial injections (frontal lobe) of D458 at day 0, day of tumor cell implantation. After a week, (n=12 mice in each set) were given 5, 10 or 20 mg/kg body weight of either DMSO or PG-S3-009 for 2 weeks, twice a week. At the end of third week, mice were killed (n=6 mice in each set) for H&E staining and remaining 6 mice per set were monitored for their survival. (c) Representative H&E sections of the brains are shown after each treatment regimens (n=6). (d) There is a significant reduction in tumor area (calculated using ImageJ software). Bar represents tumor area (mm2) of n=6 mice in each group, mean±s.d. and two-tailed t-test. *P=0.03. (e) Percentage survival for mice treated with 5 mg (upper panel), 10 mg (middle panel) and 20 mg/kg body weight of PG-S3-009 (lower panel).

Similar articles

Cited by

References

    1. Northcott PA, Jones DT, Kool M, Robinson GW, Gilbertson RJ, Cho YJ et al. Medulloblastomics: the end of the beginning. Nat Rev Cancer 2012; 12: 818–834. - PMC - PubMed
    1. Taylor MD, Northcott PA, Korshunov A, Remke M, Cho YJ, Clifford SC et al. Molecular subgroups of medulloblastoma: the current consensus. Acta Neuropathol 2012; 123: 465–472. - PMC - PubMed
    1. Gajjar A, Chintagumpala M, Ashley D, Kellie S, Kun LE, Merchant TE et al. Risk-adapted craniospinal radiotherapy followed by high-dose chemotherapy and stem-cell rescue in children with newly diagnosed medulloblastoma (St Jude Medulloblastoma-96): long-term results from a prospective, multicentre trial. Lancet Oncol 2006; 7: 813–820. - PubMed
    1. Mabbott DJ, Spiegler BJ, Greenberg ML, Rutka JT, Hyder DJ, Bouffet E. Serial evaluation of academic and behavioral outcome after treatment with cranial radiation in childhood. J Clin Oncol 2005; 23: 2256–2263. - PubMed
    1. Northcott PA, Korshunov A, Witt H, Hielscher T, Eberhart CG, Mack S et al. Medulloblastoma comprises four distinct molecular variants. J Clin Oncol 2011; 29: 1408–1414. - PMC - PubMed

Publication types

MeSH terms

Grants and funding