

Subconcussive Head Impact Exposure and White Matter Tract Changes over a Single Season of Youth Football
- PMID: 27775478
- PMCID: PMC5131834
- DOI: 10.1148/radiol.2016160564
Subconcussive Head Impact Exposure and White Matter Tract Changes over a Single Season of Youth Football
Abstract
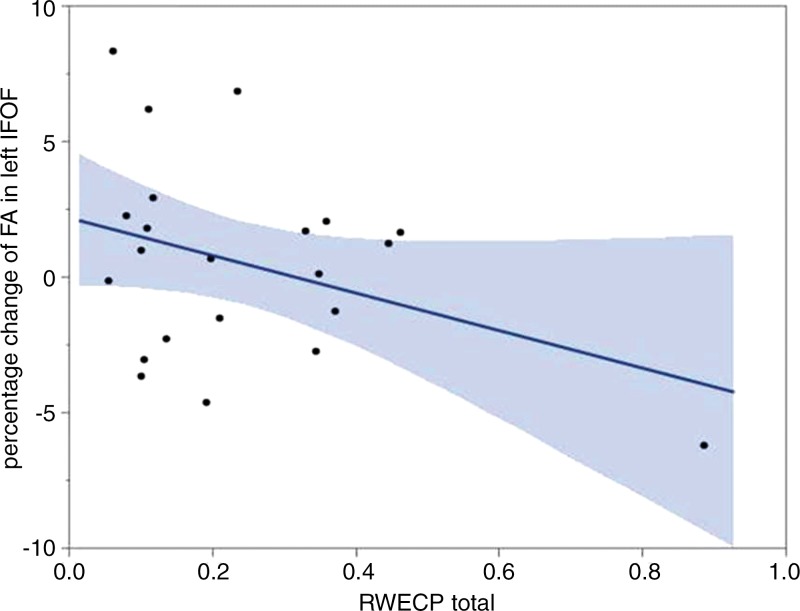
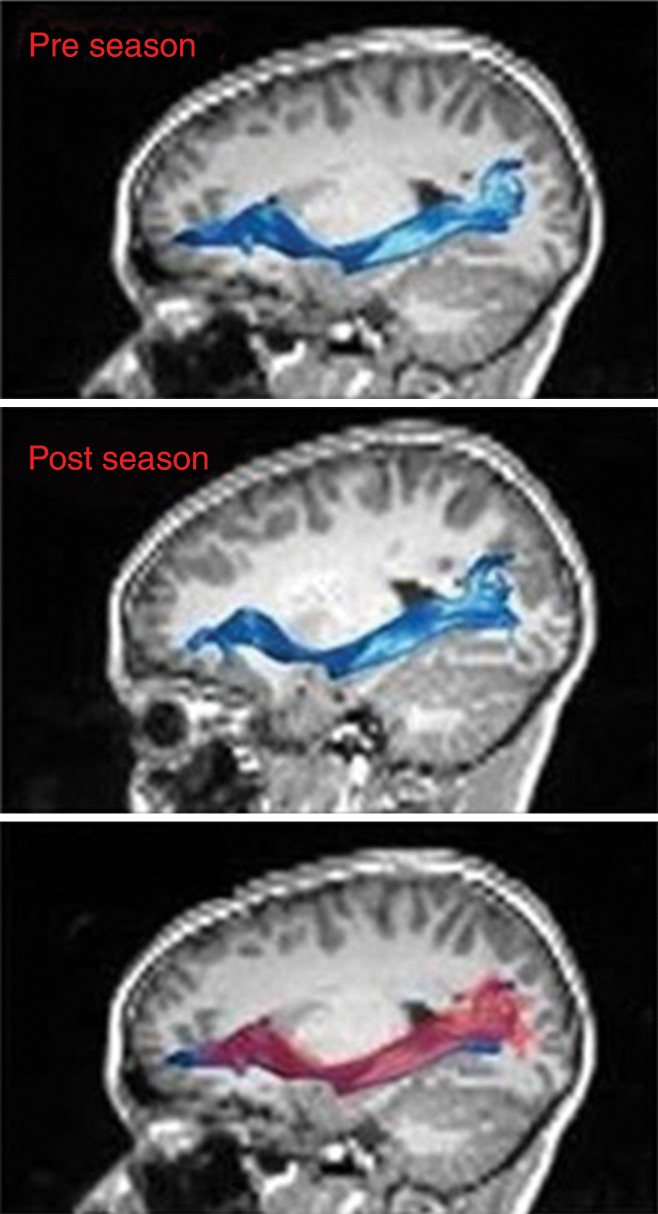
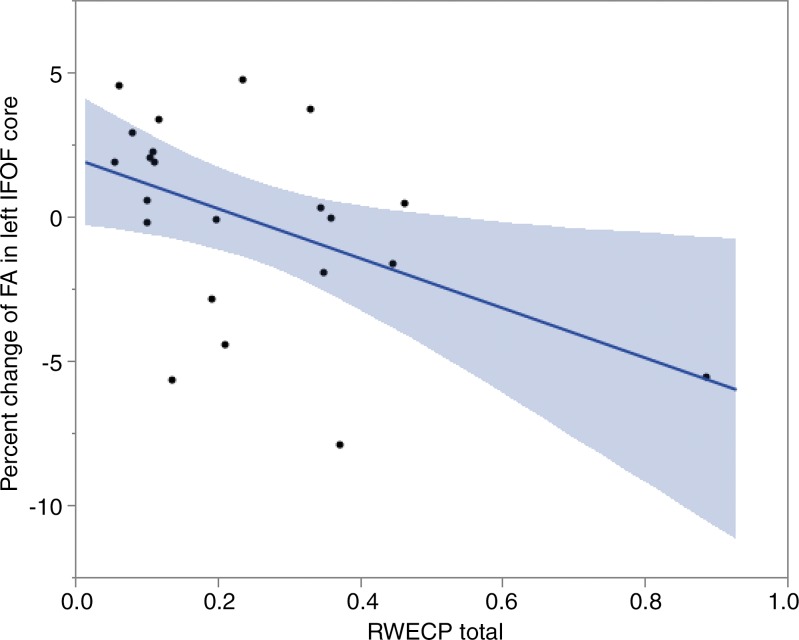
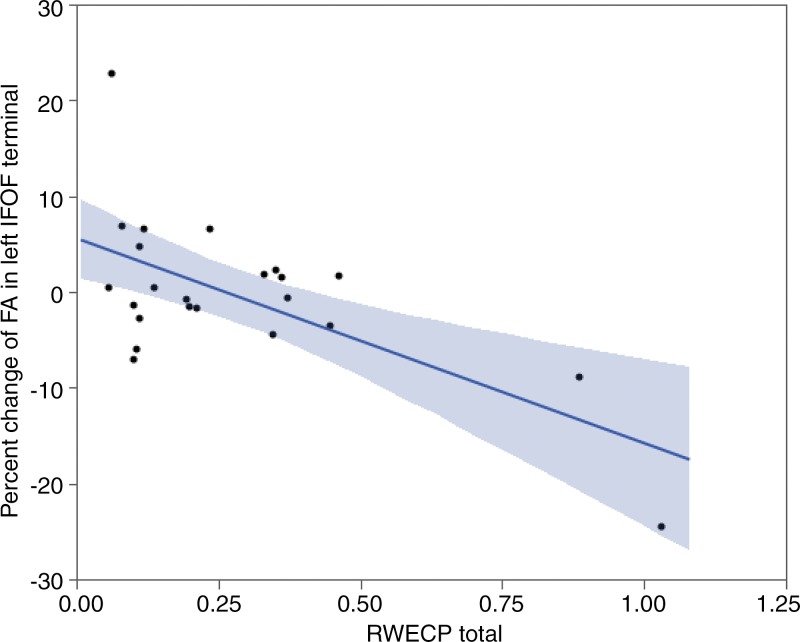
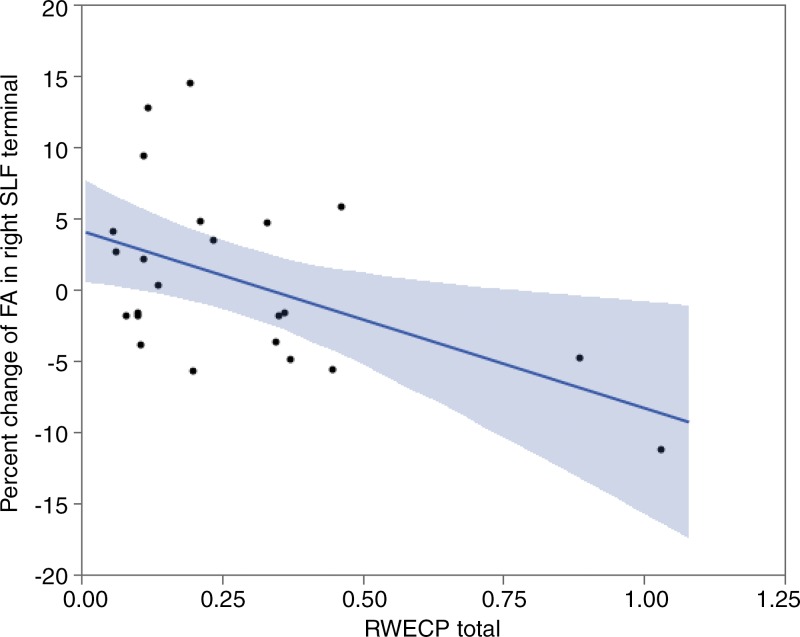
Purpose To examine the effects of subconcussive impacts resulting from a single season of youth (age range, 8-13 years) football on changes in specific white matter (WM) tracts as detected with diffusion-tensor imaging in the absence of clinically diagnosed concussions. Materials and Methods Head impact data were recorded by using the Head Impact Telemetry system and quantified as the combined-probability risk-weighted cumulative exposure (RWECP). Twenty-five male participants were evaluated for seasonal fractional anisotropy (FA) changes in specific WM tracts: the inferior fronto-occipital fasciculus (IFOF), inferior longitudinal fasciculus, and superior longitudinal fasciculus (SLF). Fiber tracts were segmented into a central core and two fiber terminals. The relationship between seasonal FA change in the whole fiber, central core, and the fiber terminals with RWECP was also investigated. Linear regression analysis was conducted to determine the association between RWECP and change in fiber tract FA during the season. Results There were statistically significant linear relationships between RWEcp and decreased FA in the whole (R2 = 0.433; P = .003), core (R2 = 0.3649; P = .007), and terminals (R2 = 0.5666; P < .001) of left IFOF. A trend toward statistical significance (P = .08) in right SLF was observed. A statistically significant correlation between decrease in FA of the right SLF terminal and RWECP was also observed (R2 = 0.2893; P = .028). Conclusion This study found a statistically significant relationship between head impact exposure and change of FA fractional anisotropy value of whole, core, and terminals of left IFOF and right SLF's terminals where WM and gray matter intersect, in the absence of a clinically diagnosed concussion. © RSNA, 2016.
Figures
References
-
- Langlois JA, Rutland-Brown W, Wald MM. The epidemiology and impact of traumatic brain injury: a brief overview. J Head Trauma Rehabil 2006;21(5):375–378. - PubMed
-
- Bachynski KE, Goldberg DS. Youth sports & public health: framing risks of mild traumatic brain injury in american football and ice hockey. J Law Med Ethics 2014;42(3):323–333. - PubMed
-
- Nonfatal Traumatic Brain Injuries Related to Sports and Recreation Activities Among Persons Aged ≤19 Years—United States, 2001–2009. http://www.cdc.gov/mmwr/preview/mmwrhtml/mm6039a1.htm. Accessed February 3, 2015. - PubMed
-
- Kontos AP, Elbin RJ, Fazio-Sumrock VC, et al. Incidence of sports-related concussion among youth football players aged 8-12 years. J Pediatr 2013;163(3):717–720. - PubMed
-
- Smith SM, Jenkinson M, Woolrich MW, et al. Advances in functional and structural MR image analysis and implementation as FSL. Neuroimage 2004;23(Suppl 1):S208–S219. - PubMed
MeSH terms
Grants and funding
LinkOut - more resources
Full Text Sources
Other Literature Sources
Medical
Miscellaneous
