. 2016 Nov;22(11):1303-1313.
doi: 10.1038/nm.4198. Epub 2016 Oct 24.

PIM1 kinase regulates cell death, tumor growth and chemotherapy response in triple-negative breast cancer

Affiliations

PIM1 kinase regulates cell death, tumor growth and chemotherapy response in triple-negative breast cancer

Fara Brasó-Maristany et al. Nat Med. 2016 Nov.

Erratum in

Abstract

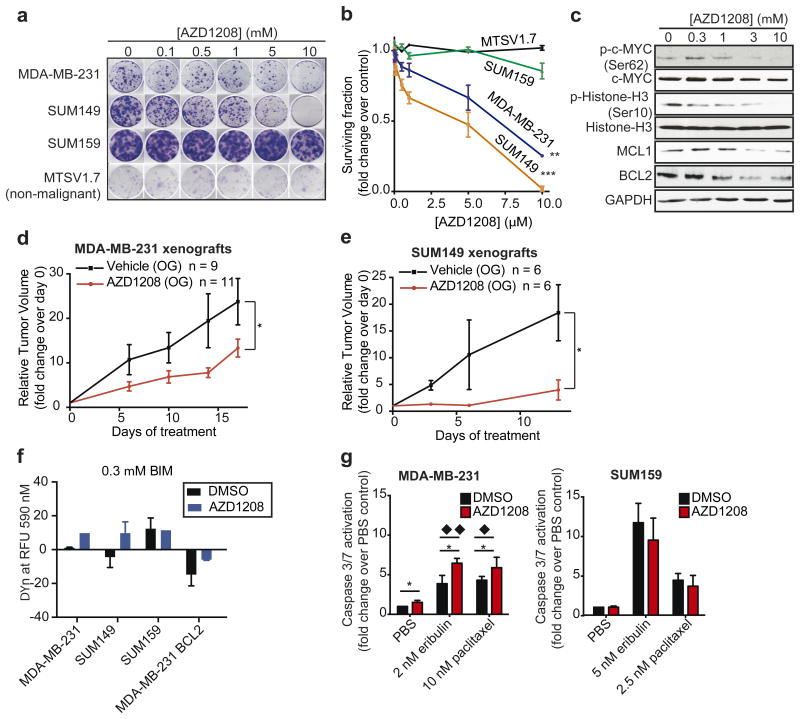
Triple-negative breast cancers (TNBCs) have poor prognosis and lack targeted therapies. Here we identified increased copy number and expression of the PIM1 proto-oncogene in genomic data sets of patients with TNBC. TNBC cells, but not nonmalignant mammary epithelial cells, were dependent on PIM1 for proliferation and protection from apoptosis. PIM1 knockdown reduced expression of the anti-apoptotic factor BCL2, and dynamic BH3 profiling of apoptotic priming revealed that PIM1 prevents mitochondrial-mediated apoptosis in TNBC cell lines. In TNBC tumors and their cellular models, PIM1 expression was associated with several transcriptional signatures involving the transcription factor MYC, and PIM1 depletion in TNBC cell lines decreased, in a MYC-dependent manner, cell population growth and expression of the MYC target gene MCL1. Treatment with the pan-PIM kinase inhibitor AZD1208 impaired the growth of both cell line and patient-derived xenografts and sensitized them to standard-of-care chemotherapy. This work identifies PIM1 as a malignant-cell-selective target in TNBC and the potential use of PIM1 inhibitors for sensitizing TNBC to chemotherapy-induced apoptotic cell death.


Figures

Figure 1
Figure 1. PIM1 gene expression is upregulated in TNBC and associated with its gene copy-number levels
(a) PIM1 gene expression was determined in the Guy's Hospital TNBC-enriched cohort,, the TCGA Breast and METABRIC datasets. The cohorts were divided into TNBCs (red) and non-TNBCs (blue) according to their IHC-defined receptor status. Gene expression is reported as median-centred expression log2 values. The number of patients (n) per group is shown. p-values were determined using a Wilcoxon rank-sum test. (b) PIM1 gene expression values (y-axis) were plotted against absolute gene copy-number (CN) across the TNBCs from the Guy's Hospital, the TCGA and the METABRIC datasets. Tumors were segregated according to their PIM1 gene CN status in those with high amplification (CN > 4), moderate gain (CN = 3-4), neutral copy-number (CN = 2) or deletion (CN < 2). The number of samples (n) per group is shown. p-values were determined using Kruskal-Wallis analysis of variance. (c) PIM1 gene expression was assessed in the Neve et al. cancer cell line expression dataset. Cell lines were divided into TNBCs (red) and non-TNBCs (blue) according to their receptor status. p-values were determined using a Welch's t-test (Satterthwaite's approximation). (d) PIM1 protein expression was assessed by Western Blotting in a panel of breast cancer and non-malignant cell lines. (e) Relative PIM1 protein expression in TNBC versus non-TNBC cell lines, as quantified by densitometry using ImageJ from three independent experiments and shown as fold change over control (-). β-ACTIN was used a loading control for normalization. p-value was determined using a two-tailed unpaired t-test.
Figure 2
Figure 2. PIM1 supports cell population growth and clonogenic survival of TNBC cells
(a) Cell population growth over time of HCC38, SUM149, MDA-MB-231, CAL51, SUM159, BT474, and HMEC cells upon treatment with two distinct PIM1 shRNAs (PIM1#1 and PIM1#2) or non-targeting (NT) control shRNA. PIM1 protein expression was assessed by WB and percentage of knockdown (KD) quantified by densitometry using ImageJ. β-ACTIN protein levels were used as internal control. (b) Rescue-of-function experiment of cell population growth over time in SUM149 cells treated with doxycycline-inducible PIM1 shRNA#1 or NT shRNA control and infected with lentivirus stably overexpressing a shRNA#1-resistant and V5-tagged PIM1 or control V5-tagged LacZ. Cells were grown in the absence (-) or presence of doxycycline (+PIM1 KD). Expression of V5-tagged PIM1 and LacZ proteins and KD of endogenous PIM1 were confirmed by WB. GAPDH was used as an internal control. (c) Representation and quantification of the clonogenic survival of HCC38, SUM149, MDA-MB-231 and SUM159 cells upon treatment with PIM1 or NT shRNAs. The data in (a), (b) and (c) represent the mean ± standard error of the mean values of three independent experiments. The last time point (day 3 in (a) and day 6 in (b)) were analysed using a two-tailed unpaired t-test (* = p-value < 0.05, ** = p-value < 0.01, *** = p-value < 0.001).
Figure 3
Figure 3. PIM1 inhibits activation of mitochondrial-mediated apoptosis in TNBC cells
MDA-MB-231 cells were transfected with 20nM PIM1 siRNA or control NT siRNA prior to measure changes in (a) Caspase 3/7 activation by Caspase-Glo3/7 assay and (b) cell population growth by Cell-Titer blue assay in a time-dependent manner. The time points represent the mean ± standard deviation of three independent biological replicates (** = p-value < 0.01 (by two-tailed unpaired t-test)). (c) Representative WB analysis of lysates from MDA-MB-231, SUM149, SUM159 and BT474 cells exposed for 4 days to PIM1 or NT siRNA. PIM1, BCL2 and GAPDH expression were assessed. (d) MDA-MB-231 cells overexpressing BCL2 or RFP control were transfected with PIM1 siRNA or NT siRNA control. Caspase 3/7 activation was assessed 72h post-transfection. BCL2 expression was assessed by WB and β-ACTIN was used as internal loading control. The data represent the mean ± standard error of the mean values of three independent experiments, and were analysed using an ANOVA with Tukey procedure (*** = p-value < 0.001). (e) Representation of BIM-induced mitochondrial membrane permeabilization (ΔΨn priming determined by fluorescence RFU 590nm) achieved with 0.3 μM of BIM peptide in MDA-MB-231, SUM149, SUM159, BCL2-overexpressing MDA-MB-231 cells treated with NT and PIM1 siRNAs. The data represent the mean ± standard error of the mean values of three independent experiments. (f) Cell population growth of MDA-MB-231 cells overexpressing BCL2 or RFP control treated with PIM1 or NT siRNA was measured every two days, starting at 2-days post-transfection (Day 0 = 48h post-transfection, Day 2 = 96h post-transfection, Day 4 = 144h post-transfection). The data represent the mean ± standard error of the mean values of three independent experiments, and were analysed using a Welch's ANOVA (*= p-value < 0.05).
Figure 4
Figure 4. PIM1 acts through the MYC-activation pathway
(a) Representation of PIM1 expression, c-MYC phosphorylation at Ser62, total c-MYC expression, Histone H3 phosphorylation at Ser10, total Histone H3 levels and MCL1 expression, as determined by WB in MDA-MB-231, SUM149, SUM159 and BT474 cells upon PIM1 siRNA-mediated knockdown. (b) Histograms representing mRNA levels of PIM1, MCL1 and c-MYC in MDA-MB-231 cells 72h post-transfection with PIM1 siRNA assessed by qRT-PCR. GAPDH was used as housekeeping gene for normalization. The data represent the mean ± standard error of the mean values of three independent experiments, and were analysed using a two-tailed unpaired t-test (* = p-value < 0.05, *** = p-value < 0.001). (c) Cell population growth over time in Myc-overexpressing SUM149 cells or empty-vector (EV) control. Cells were grown in the presence of doxycycline and transfected with PIM1 siRNA. Expression of MYC, MCL1 and PIM1 were detected by WB. GAPDH was used as an internal control. The data represent the mean ± standard error of the mean values of three independent experiments, and were analysed using an ANOVA with Tukey procedure (*** = p-value < 0.001). (d) The Chandriani et al. MYC-transcriptional signature is plotted over PIM1 gene expression for Guy's Hospital, the TCGA and the METABRIC datasets. Tumor classification by PAM50 molecular intrinsic subtypes is shown. Correlation values and p-values were determined using Pearson's correlation. (e) Volcano plot illustrating changes of mRNA expression (log2 values) of 730 genes in MDA-MB-231 and SUM149 upon PIM1 knockdown as determined by nCounter PanCancer Pathways gene expression analysis. Top 20 gene expression changes are colored with regards to their associated signalling pathways as described by nCounter PanCancer Pathways codeset. (f) Representation of PIM1, p27, SHP2 and EPHA2 expression levels, as determined by WB in SUM149 and MDA-MB-231 cells upon PIM1 siRNA-mediated knockdown.
Figure 5
Figure 5. The pan-PIM kinase inhibitor AZD1208 impairs clonogenic survival and reduces tumor growth in in vivo xenograft models of TNBC
(a) Representation and (b) quantification of the clonogenic survival/growth of SUM159, MDA-MB-231, SUM149 and MTSV1.7 cells upon treatment with increasing concentrations of AZD1208. The data represent the mean ± standard error of the mean values of three independent experiments, and were analysed using a linear regression of log10 [AZD1208] dose response and % of survival fraction (** = p-value < 0.01 and *** = p-value < 0.001). (c) c-MYC phosphorylation at Ser62, c-MYC expression, Histone H3 phosphorylation at Ser10, Histone H3 expression, MCL1, BCL2 and GAPDH expression (housekeeping protein) were analyzed by WB in SUM149 cells following 48h of incubation with increasing concentrations of AZD1208. (d-e) Relative tumor volume (mm3) over time (days) was assessed in (d) MDA-MB-231 and (e) SUM149-tumor bearing mice following AZD1208 or vehicle control oral gavage (OG) therapy. Relative tumor volume was calculated by normalizing to tumour volume at the start of the treatment. The data represent the mean ± standard error of the mean. The number of treated mice (n) per group is shown. The last time points were analysed using a two-tailed unpaired t-test (* = p-value < 0.05). (f) Representation of BIM-induced mitochondrial membrane permeabilization (ΔΨn priming determined by fluorescence RFU 590nm) achieved with 0.3 μM of BIM peptide in MDA-MB-231, SUM149, SUM159, BCL2-overexpressing MDA-MB-231 cells treated with AZD1208 or DMSO control. The data represent the mean ± standard error of the mean values of three independent experiments. (g) Caspase 3/7 activation levels were measured in MDA-MB-231 and SUM159 cells following 72h of incubation with eribulin or paclitaxel in the presence or absence of 3μM AZD1208. The data represent the mean ± standard error of the mean values of three independent experiments, and were analysed using a two-tailed unpaired t-test (* = p-value < 0.05) and an ANOVA with Tukey procedure (◆ ◆= p-value < 0.01, ◆ = p-value < 0.05)
Figure 6
Figure 6. The pan-PIM kinase inhibitor AZD1208 enhances response to chemotherapy in TNBC cells and xenografts
(a and b) Representation and quantification of MDA-MB-231, SUM149, SUM159 and MTSV1.7 colony formation during dose-response curves to (a) paclitaxel and (b) eribulin in the presence of AZD1208 (3μM in MDA-MB-231, SUM159 and MTSV1.7 cells and 1μM in SUM149 cells) or DMSO vehicle control (-). The data represent the mean ± standard error of the mean values of the surviving fraction for each chemotherapy dose point with DMSO control or AZD1208 across at least three independent experiments, and were analysed using a paired t-test. (c-d) Relative tumor volume (mm3) over time (days) was assessed in (c) MDA-MB-231 and (d) SUM149 xenografts following treatment with AZD1208 by oral gavage (OG), eribulin by intravenous tail-vein injection (IV) combinations of eribulin and AZD1208. (e-f) Relative tumor volume (mm3) over time (days) was assessed in the PDXs (e) PDX93 and (f) PDX156 following treatment with AZD1208 by oral gavage, eribulin by intraperitoneal injection (IP) or combinations of eribulin and AZD1208. Vehicle-treated tumors were used as control. The number of treated mice (n) per group is shown. Data represent the mean ± standard error of the mean and were analysed using a Welch's ANOVA (* = p-value < 0.05, ** = p-value < 0.01, *** = p-value < 0.001). (g-j) Representative images of hematoxylin and eosin staining of (g) MDA-MB-231 xenografts, (h) SUM149 xenografts, (i) PDX93 and (j) PDX156 tumors and (k-n) quantification of cell density (number of tumor cells/area) of (k) MDA-MB-231 xenografts, (l) SUM149 xenografts,(m) PDX93 and (n) PDX156 tumors at the end of the treatment with vehicle control, AZD1208, eribulin or combinations of AZD1208 and eribulin. Data in (k-n) were analysed using a one-way ANOVA Tukey multiple comparisons test (* = p-value < 0.05, ** = p-value < 0.01, *** = p-value < 0.001).

References

    1. Reis-Filho JS, Tutt AN. Triple negative tumours: a critical review. Histopathology. 2008;52:108–118. - PubMed
    1. Symmans WF, et al. Measurement of residual breast cancer burden to predict survival after neoadjuvant chemotherapy. Journal of clinical oncology : official journal of the American Society of Clinical Oncology. 2007;25:4414–4422. - PubMed
    1. Masuda H, et al. Differential response to neoadjuvant chemotherapy among 7 triple-negative breast cancer molecular subtypes. Clinical cancer research : an official journal of the American Association for Cancer Research. 2013;19:5533–5540. - PMC - PubMed
    1. Balko JM, et al. Molecular profiling of the residual disease of triple-negative breast cancers after neoadjuvant chemotherapy identifies actionable therapeutic targets. Cancer discovery. 2014;4:232–245. - PMC - PubMed
    1. Labisso WL, et al. MYC directs transcription of MCL1 and eIF4E genes to control sensitivity of gastric cancer cells toward HDAC inhibitors. Cell cycle. 2012;11:1593–1602. - PubMed

MeSH terms