. 2016 Dec;22(12):1402-1410.
doi: 10.1038/nm.4200. Epub 2016 Oct 24.

Eradication of large established tumors in mice by combination immunotherapy that engages innate and adaptive immune responses

Affiliations

Eradication of large established tumors in mice by combination immunotherapy that engages innate and adaptive immune responses

Kelly D Moynihan et al. Nat Med. 2016 Dec.

Abstract

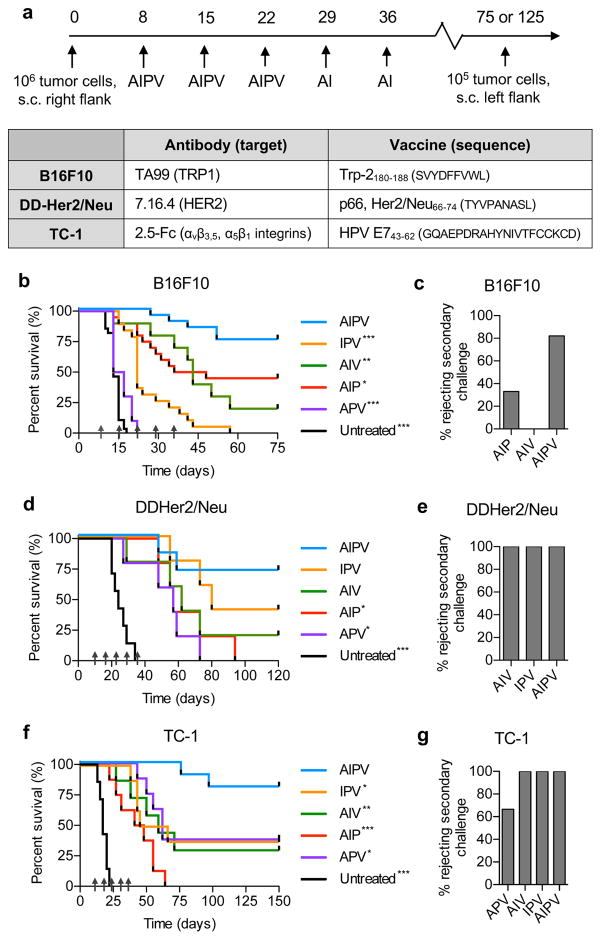
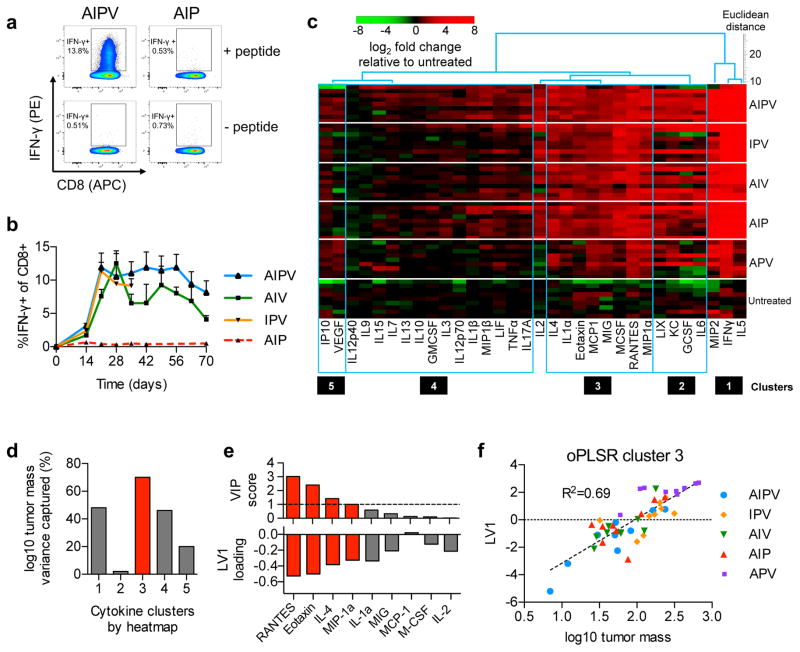
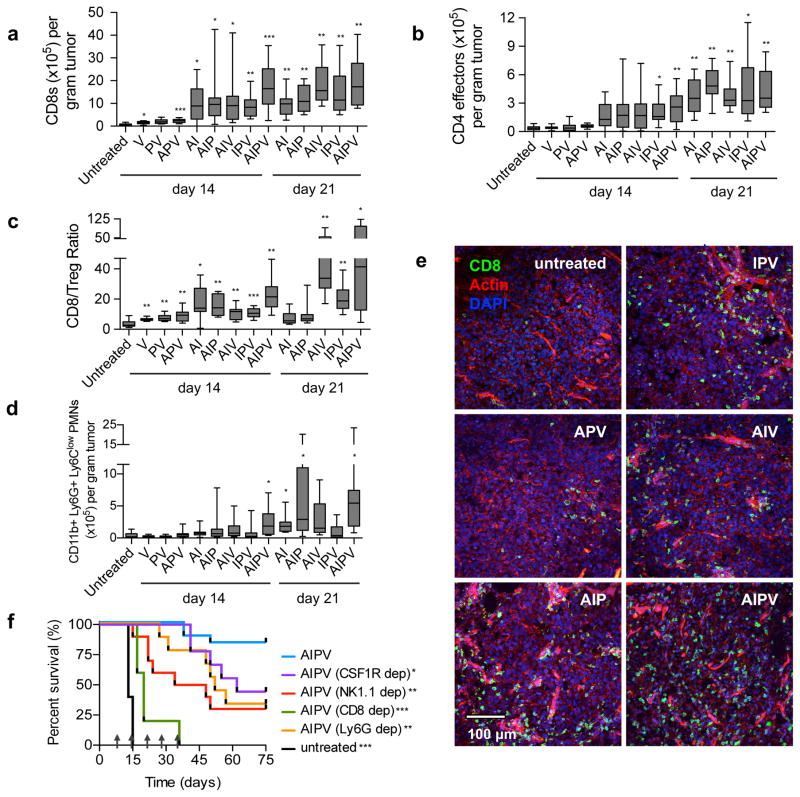
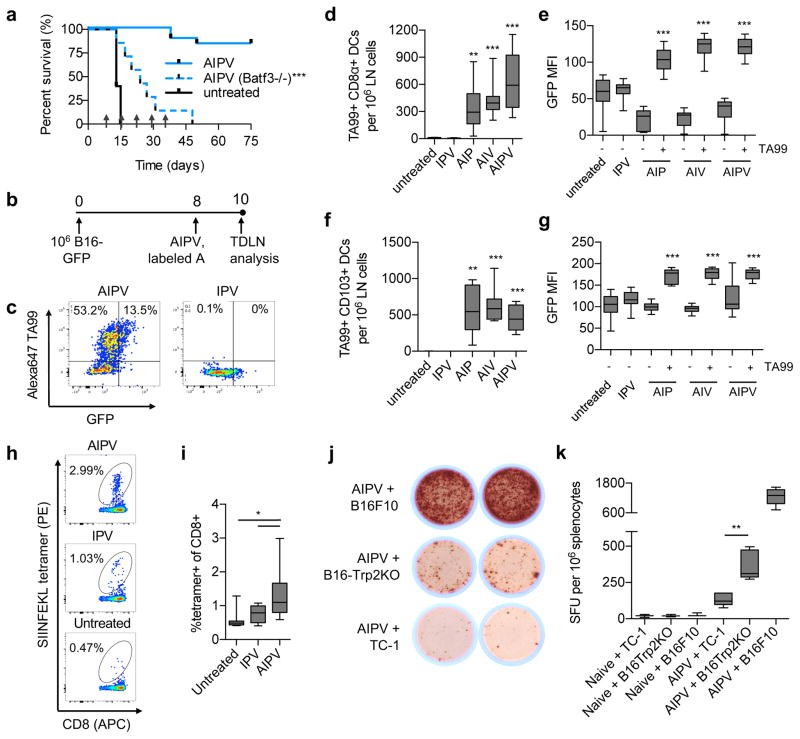
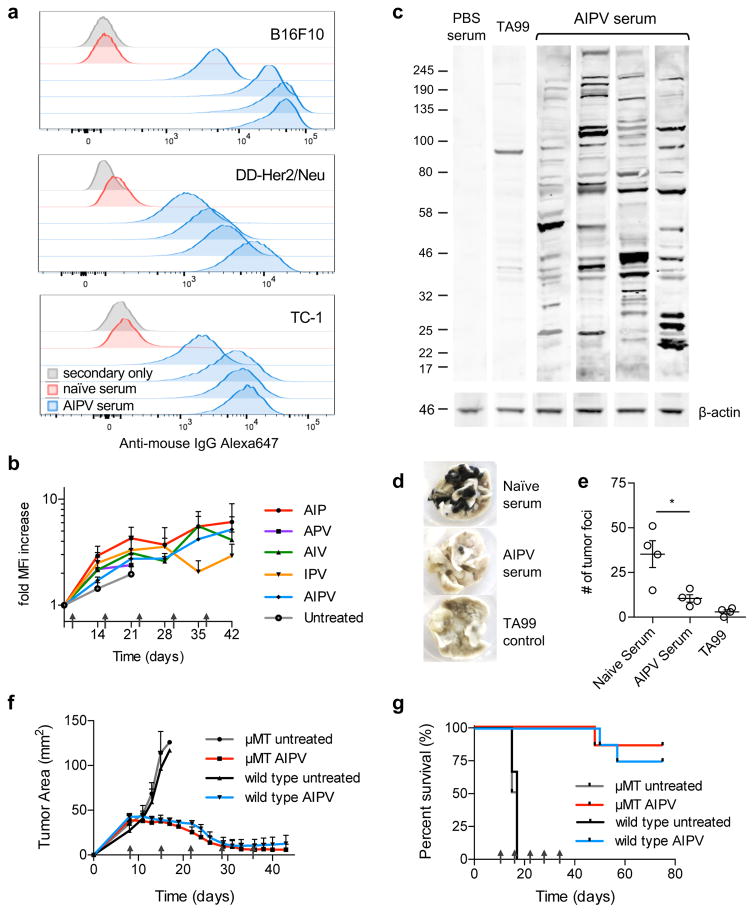
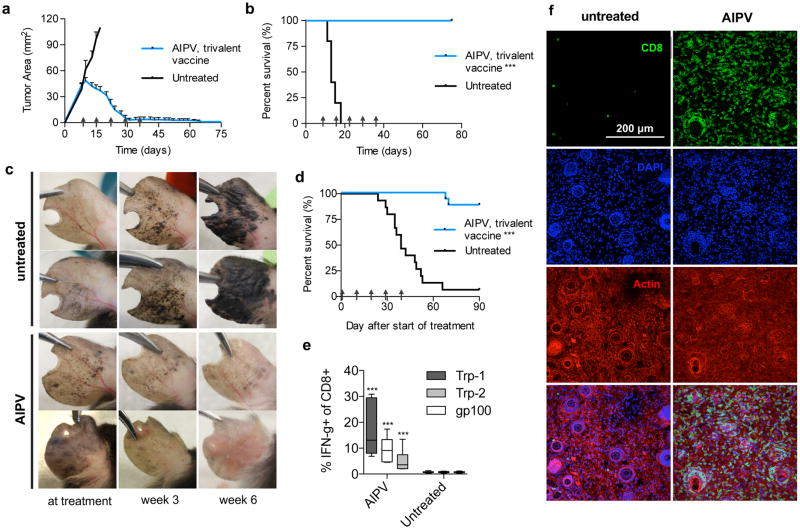
Checkpoint blockade with antibodies specific for cytotoxic T lymphocyte-associated protein (CTLA)-4 or programmed cell death 1 (PDCD1; also known as PD-1) elicits durable tumor regression in metastatic cancer, but these dramatic responses are confined to a minority of patients. This suboptimal outcome is probably due in part to the complex network of immunosuppressive pathways present in advanced tumors, which are unlikely to be overcome by intervention at a single signaling checkpoint. Here we describe a combination immunotherapy that recruits a variety of innate and adaptive immune cells to eliminate large tumor burdens in syngeneic tumor models and a genetically engineered mouse model of melanoma; to our knowledge tumors of this size have not previously been curable by treatments relying on endogenous immunity. Maximal antitumor efficacy required four components: a tumor-antigen-targeting antibody, a recombinant interleukin-2 with an extended half-life, anti-PD-1 and a powerful T cell vaccine. Depletion experiments revealed that CD8+ T cells, cross-presenting dendritic cells and several other innate immune cell subsets were required for tumor regression. Effective treatment induced infiltration of immune cells and production of inflammatory cytokines in the tumor, enhanced antibody-mediated tumor antigen uptake and promoted antigen spreading. These results demonstrate the capacity of an elicited endogenous immune response to destroy large, established tumors and elucidate essential characteristics of combination immunotherapies that are capable of curing a majority of tumors in experimental settings typically viewed as intractable.


Figures

Figure 1
Figure 1. AIPV immunotherapy cures large established tumors and establishes protective memory in multiple tumor models
a, Components of AIPV therapy and timeline of treatment. b–g, Groups of mice were inoculated with 106 tumor cells s.c. in the flank: B16F10 (b–c, n = 10/group for APV, 20/group for all other groups) and TC-1 (f–g, n = 8/group) tumor cells were injected in C57Bl/6 mice while DD-Her2/neu tumor cells (d–e, n = 7 for untreated and AIPV, n = 5 for all other groups) were injected in balb/c mice. On day 8 post implantation, AIPV treatment or ternary combinations were initiated following the timeline in a. Shown are survival (b, d, f) over time and the fraction of long term survivors that rejected a rechallenge with 105 tumor cells on day 75 for B16F10 and day 125 for TC-1 and DD-Her2/Neu (c, e, g). Data compiled from 2–3 independent experiments. Arrows indicate treatment time points. * p<0.05, ** p<0.01, *** p<0.001 versus AIPV by Log-rank (Mantel-Cox) test.
Figure 2
Figure 2. AIPV therapy primes sustained vaccine-specific T-cell responses and remodels the microenvironment of established tumors
B16F10 tumors in C57Bl/6 mice were treated with AIPV or indicated ternary combinations of the therapy components as in Fig. 1a. a–b, Peripheral blood cells were stimulated with Trp2 peptide for 6 hours in the presence of brefeldin A and then analyzed by intracellular cytokine staining. (a) Representative intracellular cytokine staining to detect Trp2-specific CD8+ T-cells in peripheral blood on day 21. (b) Mean±s.e.m. percentage IFN-γ+ among CD8+ T-cells over indicated time points (n = 5/group, b). c–f, Mice bearing B16F10 tumors were treated with the regimens indicated on the right. Seventeen days later, tumors were isolated and cytokine and chemokine levels were measured by Luminex (n = 9/group). (c) Five co-regulated clusters of cytokines and chemokines were identified by hierarchical cluster analysis and then pruning clusters by applying a threshold to linkage distance (Supplementary Fig. 5). (d) These clusters were independently tested for their ability to predict log-transformed tumor size in treated mice on day 17 using a single latent variable (LV) in an orthogonalized partial least squares regression (oPLSR) model. (e) For the best performing cluster 3 (red bar), VIP scores (a measure of each cytokine’s contribution to the LV score and overall regression performance) were used to assess the contribution of individual proteins from the cluster to the oPLSR model; VIP scores >1 (dotted line) were considered significant (top, red bars) and the loading factors for LV1 of the oPLSR model are shown (bottom, red bars). (f) A scatter plot shows the oPLSR model performance for individual mice from all treatment groups and the best fit linear regression (dotted line) (f).
Figure 3
Figure 3. AIPV therapy induces pronounced immune infiltration of tumors with efficacy dependent on innate and adaptive immune cells
a–d, B16F10 tumors treated as indicated were isolated on days 14 and 21 and quantified by flow cytometry (n = 15 animals/group for day 14, 9 animals/group for day 21, at least 2 independent experiments). Shown are boxplots (whiskers 5–95%) for tumor-infiltrating CD8+ T-cells (a), CD4+FoxP3 T-cells (b), the ratio of CD8+ T-cells to CD4+CD25hiFoxp3+ Tregs (c), CD11b+LyG+LyClow polymorphonuclear (PMN) cells (d), and representative immunofluorescence images from tumors on day 14; scale bar is 100μm (e). f, depleting antibodies against the indicated surface markers were administered i.p. beginning one day prior to initiation of AIPV therapy to deplete macrophages (CSF1R), NK cells (NK1.1), CD8+ T-cells (CD8), or neutrophils (Ly6G). Shown is survival over time (n = 5 animals/group for CD8 depletion, n = 10 animals/group for NK1.1, CSF1R, and Ly6G depletion, 2 independent experiments). Arrows indicate treatment time points. *P < 0.05, **P < 0.01, ***P < 0.001 by Welch’s t test versus untreated with Bonferroni correction for a–d. * P < 0.05, ** P < 0.01, *** P < 0.001 versus AIPV by Log-rank (Mantel-Cox) test for f.
Figure 4
Figure 4. Combination therapy elicits antibody-enhanced antigen spreading and de novo T-cell responses
a, AIPV treatment was carried out in wild type or Batf3−/− mice (n = 7 animals/group) bearing established B16F10 tumors as in Fig. 1a; mice were euthanized when tumor area exceeded 100 mm2. Shown is survival over time. Arrows indicate treatment time points. b–g, B16-GFP cells (106) were injected s.c. (n = 10 animals/group) and AIPV or indicated ternary combination treatment was applied with AlexaFluor647-labeled TA99 antibody, followed by tumor-draining LN isolation, digestion, and analysis by flow cytometry (b). Shown are representative scatter plots of CD11c+ DCs (c), enumeration of TA99+ CD11c+CD8α+CD11b and CD11c+CD103+ DCs (d and f, respectively) and MFI of GFP within CD11c+CD8α+CD11b and CD11c+CD103+ DCs (e and g, respectively) gated on either TA99+ or TA99 cells. Shown are boxplots (whiskers 5–95%) for d–g. h–i, B16-OVA cells (106) were injected s.c. and tumors were treated with AIPV as in Fig. 1a (with vaccine against Trp2); staining with SIINFEKL/H-2Kb tetramers on peripheral blood mononuclear cells was performed on day 15. Shown are representative flow plots (h) and boxplots (whiskers 5–95%) (i) from 1 of 2 independent experiments (n = 10 animals/group). j–k, AIPV treated or naïve mice were challenged with 105 B16F10 on day 75, and 6 days later splenocytes were isolated and tested for reactivity against a Trp2-KO B16F10 line generated using CRISPR/Cas9 (Supplementary Fig. 8), parental B16F10 cells, or control TC-1 cells via ELISPOT. Shown are representative wells, j, and enumeration of counts by boxplot (whiskers 5–95%), k (n = 6 animals/group). *P < 0.05, **P < 0.01, ***P < 0.001 by Welch’s t test versus untreated with Bonferroni correction for d and f, by Welch’s t test versus the TA99- fraction within the same treatment group for e and g, by ANOVA with Bonferroni post-test for i, and by t test for k.
Figure 5
Figure 5. AIPV therapy induces de novo endogenous anti-tumor antibody responses
a, indicated tumor cells were incubated with 5% serum collected on day 150 from AIPV-treated mice that had previously rejected B16F10 (top), DD-Her2/neu (middle), or TC-1 (bottom) tumors, or age-matched naïve mice. The cells were then washed and stained with Alexa647 anti-mouse IgG secondary antibody then analyzed by flow cytometry (shown are results for sera from individual treated animals, representative of 2 independent experiments of n = at least 4). b, C57Bl/6 mice bearing B16F10 tumors were treated with the indicated combination therapies as in Fig. 1a using biotinylated TA99. Mice were bled weekly and serum was depleted of TA99-biotin using streptavidin resin (Supplementary Fig. 9), then binding of remaining endogenous IgG to B16F10 cells was measured by flow cytometry as in a. Plotted is the fold change in MFI of anti-mouse IgG over time±s.e.m. (n = 5/group). c, Western blot of B16F10 tumor cell lysate with serum from AIPV-treated mice, PBS-treated mice, or TA99 with detection using an anti-mouse-IgG-IRDye800 secondary antibody. Shown is 1 representative of 2 independent experiments. d–e, 350 μL serum from AIPV treated mice (day 150) or age-matched naïve mice (n = 4 animals/group) was incubated at 57°C for 1h to inactivate complement and transferred into naïve recipients, followed by challenge with 2.5x10⁵ B16F10 cells intravenously. Lungs were isolated 17 days later and nodules were counted in a blinded fashion. Shown are representative lungs (d) and mean counts±s.e.m. (e). Data shown is 1 representative of 2 independent experiments. f–g, B cell-deficient μMT or wild type C57Bl/6 mice were inoculated with B16F10 tumors and left untreated or received AIPV therapy as in Fig. 1a. Shown are mean±s.e.m tumor growth curves (f) and overall survival (g) (n = 8/group for AIPV treated groups, n = 4/group for untreated). Arrows indicate treatment time points. *P < 0.05, **P < 0.01, ***P < 0.001 by one-way ANOVA with Bonferroni post-test.
Figure 6
Figure 6. AIPV with a trivalent vaccine is curative for established B16F10 tumors and induces regression in BRaf/Pten autochthonous melanoma
a–b, Established B16F10 tumors were treated with AIPV as outlined in Fig. 1a using a trivalent vaccine targeting Trp2, Trp1, and gp 100. Shown are tumor area measurements (a, mean±s.e.m.) and survival (b) (n = 10 animals/group). c–e, BRafCAPtenloxPTyr::CreERT2 mice were painted with 4-hydroxytamoxifen on one ear and treated with AIPV (including trivalent vaccine) beginning 28 days later when visible lesions were apparent. Shown are representative photographs of AIPV treated or untreated ears at treatment, 3 weeks after treatment initiation, and 6 weeks after treatment initiation (c), and survival over time (d) (n = 16 animals/group, compiled from 4 independent experiments). Mice were euthanized when tumor coverage exceeded 90% of the ear. e, On day 48, peripheral blood was stimulated with peptide antigens for 6 hours in the presence of golgi inhibitor and intracellular cytokine staining was performed to assess CD8+ T-cell responses against each vaccine antigen. Shown are boxplots (whiskers 5–95%) (quantified as a fraction of total CD8+ T-cells, n = 7 animals/group). f, BRafCAPtenloxPTyr::CreERT2 mice were painted with 4-hydroxytamoxifen on the left flank and treated with AIPV (including trivalent vaccine) beginning on day 36. Shown are images of representative immunofluorescence from tumors taken on day 70 (n = 8 tumors per condition); scale bar is 200μm. Arrows indicate treatment time points. ***P<0.0001 by Welch’s t test for d, or by Log-rank (Mantel-Cox) test for b and e.

Comment in

References

    1. Hodi FS, et al. Improved Survival with Ipilimumab in Patients with Metastatic Melanoma. New England Journal of Medicine. 2010;363:711–723. doi: 10.1056/NEJMoa1003466. - DOI - PMC - PubMed
    1. Topalian SL, et al. Safety, Activity, and Immune Correlates of Anti–PD-1 Antibody in Cancer. New England Journal of Medicine. 2012;366:2443–2454. doi: 10.1056/NEJMoa1200690. - DOI - PMC - PubMed
    1. Larkin J, et al. Combined Nivolumab and Ipilimumab or Monotherapy in Untreated Melanoma. The New England journal of medicine. 2015;373:23–34. doi: 10.1056/NEJMoa1504030. - DOI - PMC - PubMed
    1. Mellman I, Coukos G, Dranoff G. Cancer immunotherapy comes of age. Nature. 2011;480:480–489. doi: 10.1038/nature10673. - DOI - PMC - PubMed
    1. Drake CG. Combination immunotherapy approaches. Annals of Oncology. 2012;23:viii41–viii46. doi: 10.1093/annonc/mds262. - DOI - PMC - PubMed

Publication types

MeSH terms