. 2016 Nov 22;10(11):10555-10562.
doi: 10.1021/acsnano.6b06559. Epub 2016 Oct 28.

Visualizing the Role of Molecular Orbitals in Charge Transport through Individual Diarylethene Isomers

Affiliations

Visualizing the Role of Molecular Orbitals in Charge Transport through Individual Diarylethene Isomers

Gaël Reecht et al. ACS Nano. .

Abstract

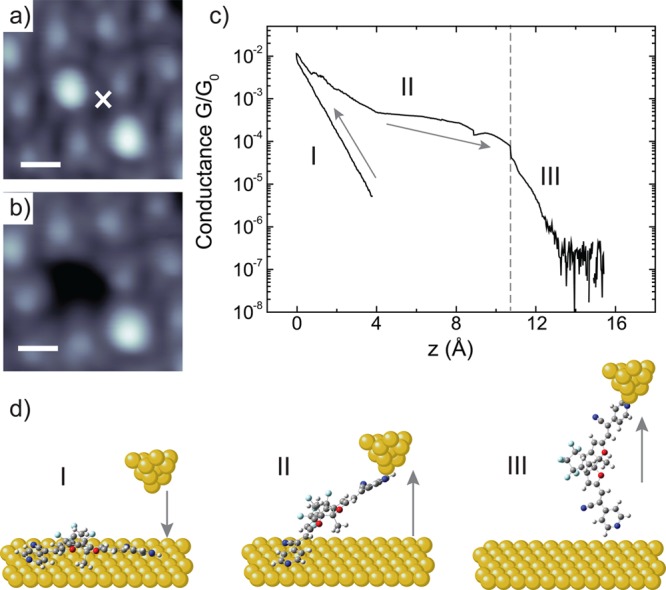
Diarylethene molecules are prototype molecular switches with their two isomeric forms exhibiting strikingly different conductance, while maintaining similar length. We employed low-temperature scanning tunneling microscopy (STM) to resolve the energy and the spatial extend of the molecular orbitals of the open and closed isomers when lying on a Au(111) surface. We find an intriguing difference in the extension of the respective HOMOs and a peculiar energy splitting of the formerly degenerate LUMO of the open isomer. We then lift the two isomers with the tip of the STM and measure the current through the individual molecules. By a simple analytical model of the transport, we show that the previously determined orbital characteristics are essential ingredients for the complete understanding of the transport properties. We also succeeded in switching the suspended molecules by the current, while switching the ones which are in direct contact to the surface occurs nonlocally with the help of the electric field of the tip.

Keywords: charge transport; diarylethene; molecular switch; scanning tunneling microscopy; scanning tunneling spectroscopy.


Conflict of interest statement

The authors declare no competing financial interest.

Figures

Figure 1
Figure 1
(a) Chemical structure of the open (left) and closed (right) forms of the C5F-4Py molecule. (b) Large-scale STM image (75 × 75 nm2) of the Au(111) surface with molecular islands of C5F-4Py (V = −0.8 V, I = 40 pA). (c) High-resolution STM image (6.5 × 6.5 nm2) of a molecular island (V = 0.1 V, I = 40 pA). Proposed model of the C5F-4Py calculated in gas phase is added as overlay.
Figure 2
Figure 2
STM images (a) before and (b) after a voltage pulse realized at the position marked by the white cross, with a positive voltage of 10 V applied for 100 s and a tip retraction of 5 nm from the set-point position (STM topographies: V = 0.8 V, I = 40 pA.).
Figure 3
Figure 3
(a) STM image of a molecular island with one modified molecule (7 × 7 nm2, V = 0.02 V, I = 75 pA). (b) dI/dV spectra recorded on a modified (red) and a nonmodified (black) molecule where indicated with crosses in the STM image. (c–g) Constant current dI/dV maps of the area framed by the black (c–e) and red (f–g) rectangles in the image in (a). The voltages used for these maps correspond to the energy of the molecular states observed in the dI/dV spectra shown in (b). The molecular model is overlaid in these maps for a better perception.
Figure 4
Figure 4
STM images of a molecular island (a) before and (b) after the lifting procedure realized at the white cross location (7 × 7 nm2, V = 0.1 V, I = 40 pA). Before the image in (b) is recorded, the tip is cleaned to not have the lifted molecule on the tip apex. (c) Evolution of the conductance as a function of z, i.e., the tip height, during the lifting of a molecule. This procedure includes an approach of the tip until a contact with the molecule is formed (regime I) and subsequent retraction, until the molecule is detached from the surface (regimes II and III). The bias applied at the junction is 50 mV. (d) Scheme of the junction corresponding to the different sections in the curve in (c).
Figure 5
Figure 5
(a) Typical G(z) curves recorded during the lifting of an open (black) and a closed (red) molecule at a bias of 50 mV. (b) Histogram of ln(G/G0) recorded for 31 (32) open (closed) molecules. The value of the conductance is obtained by averaging the G(z) curve in the plateau region (see gray rectangle in a). The arrows show the position of the average conductance obtained with the statistics.
Figure 6
Figure 6
Schemes of the model used to explain differences of conductance. (a) For the closed form, the molecule is represented by two states (HOMO and LUMO), with an electronic coupling (Γ), which is the same for both states and both electrodes (L and R). (b) For the open form, the LUMO is represented by two states with a hopping parameter (tH), which links them. The electronic coupling to the electrode for the LUMO (ΓL) is different than the one for the HOMO (ΓH). The dI/dV maps associated with each of the states are shown next to the models.
Figure 7
Figure 7
(a) Plot of transmission curves calculated with the model of the simple Breit−Wigner distribution from the states of the closed molecule (red line) and the open one (dashed black line), and with the complete model of the open molecule (full black line). (b) Plot of the ratio of the transmission at the Fermi energy between the open and closed models, as a function of the hopping parameter tH and for different values of electronic coupling (Γ = ΓL = ΓH). (c) Plot of the ratio of the transmission at the Fermi energy between open and closed models, as a function of the ratio of the electronic coupling (Γ/ΓH), for different values of tH and Γ (with Γ = ΓL). (d) Plot of the ratio of transmission at the Fermi energy between the open and closed models without considering the hopping model for the open form, as a function of the ratio of the electronic coupling (Γ/ΓH), for different values of Γ (with Γ = ΓL).
Figure 8
Figure 8
STM images (a) before and (b) after a lifting experiment. (c) G(z) curve at 50 mV. The red curve is recorded when a closed molecule (indicated by red cross in a) is lifted. The blue curve is recorded with the same molecule, but after a current drop was measured when a voltage ramp was applied while the molecule was suspended (see inset). The black curve, for comparison, is a typical G(z) curve measured with an open molecule. (d) dI/dV spectra recorded on top of the molecule before (red curve) and after (blue curve) the lifting experiment are shown in (c). The black curve, for comparison, is a typical spectrum recorded on an open molecule.

References

    1. Caroll R. L.; Gorman C. B. The Genesis of Molecular Electronics. Angew. Chem., Int. Ed. 2002, 41, 4378–4400. 10.1002/1521-3773(20021202)41:23<4378::AID-ANIE4378>3.0.CO;2-A. - DOI - PubMed
    1. Cai L.; Cabassi M. A.; Yoon H.; Cabarcos O. M.; McGuiness C. L.; Flatt A. K.; Allara D. L.; Tour J. M.; Mayer T. S. Reversible Bistable Switching in Nanoscale Thiol-Substituted Oligoaniline Molecular Junctions. Nano Lett. 2005, 5, 2365–2372. 10.1021/nl051219k. - DOI - PubMed
    1. Choi B.; Kahng S.; Kim S.; Kim H.; Kim H.; Song Y. J.; Ihm J.; Kuk Y. Conformational Molecular Switch of the Azobenzene Molecule: A Scanning Tunneling Microscopy Study. Phys. Rev. Lett. 2006, 96, 156106.10.1103/PhysRevLett.96.156106. - DOI - PubMed
    1. Liljeroth P.; Repp J.; Meyer G. Current-Induced Hydrogen Tautomerization and Conductance Switching of Naphthalocyanine Molecules. Science 2007, 317, 1203–1206. 10.1126/science.1144366. - DOI - PubMed
    1. Katsonis N.; Kudernac T.; Walko M.; van der Molen S.; van Wees B.; Feringa B. Reversible Conductance Switching of Single Diarylethenes on a Gold Surface. Adv. Mater. 2006, 18, 1397.10.1002/adma.200600210. - DOI

Publication types

LinkOut - more resources