. 2016 Dec;13(12):1043-1049.
doi: 10.1038/nmeth.4042. Epub 2016 Oct 24.

Complex transcriptional modulation with orthogonal and inducible dCas9 regulators

Affiliations

Complex transcriptional modulation with orthogonal and inducible dCas9 regulators

Yuchen Gao et al. Nat Methods. 2016 Dec.

Abstract

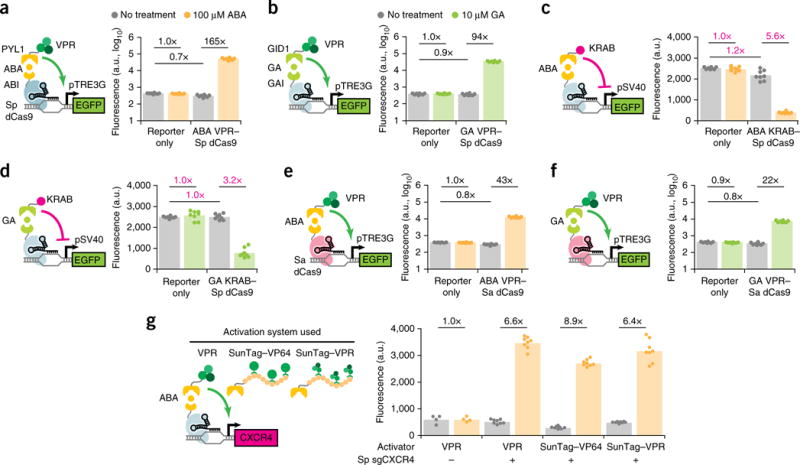
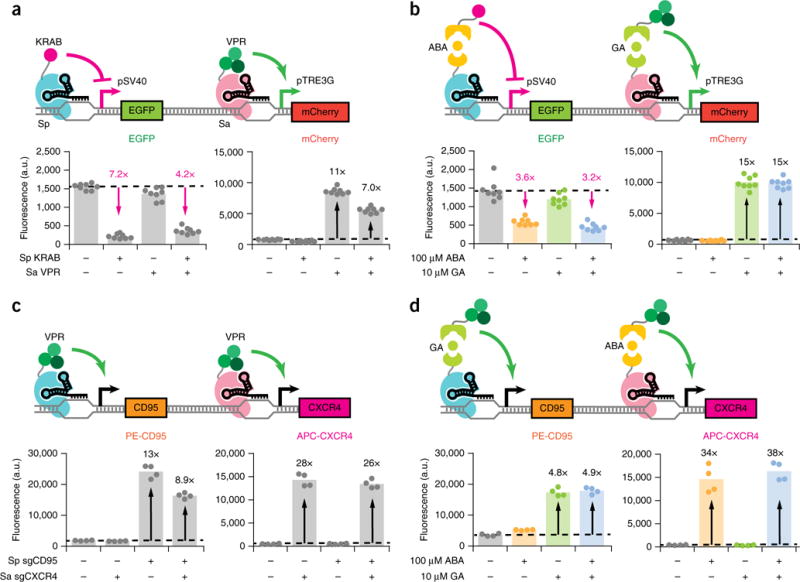
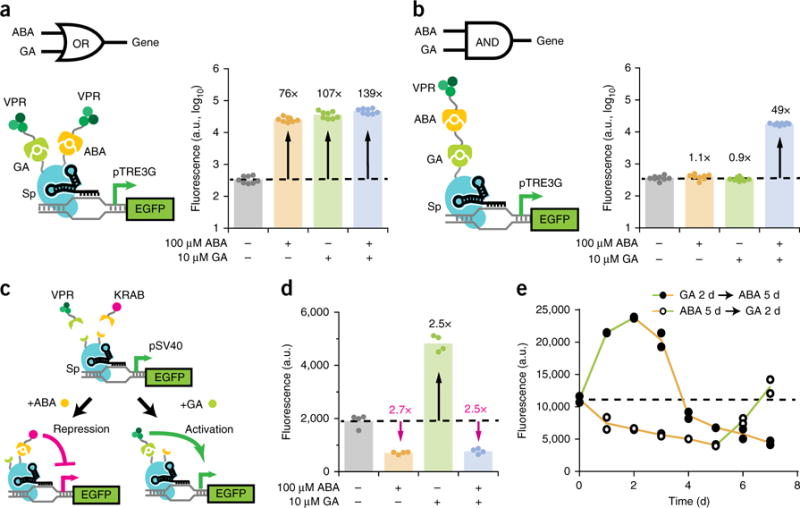
The ability to dynamically manipulate the transcriptome is important for studying how gene networks direct cellular functions and how network perturbations cause disease. Nuclease-dead CRISPR-dCas9 transcriptional regulators, while offering an approach for controlling individual gene expression, remain incapable of dynamically coordinating complex transcriptional events. Here, we describe a flexible dCas9-based platform for chemical-inducible complex gene regulation. From a screen of chemical- and light-inducible dimerization systems, we identified two potent chemical inducers that mediate efficient gene activation and repression in mammalian cells. We combined these inducers with orthogonal dCas9 regulators to independently control expression of different genes within the same cell. Using this platform, we further devised AND, OR, NAND, and NOR dCas9 logic operators and a diametric regulator that activates gene expression with one inducer and represses with another. This work provides a robust CRISPR-dCas9-based platform for enacting complex transcription programs that is suitable for large-scale transcriptome engineering.


Conflict of interest statement

COMPETING FINANCIAL INTERESTS

The authors declare no competing financial interests.

Figures

Figure 1
Figure 1
A modular dCas9 platform for inducible gene activation and repression. (a,b) Fluorescence quantification after 48 h induction for HEK293T pTRE3G–EGFP cells transfected with Sp sgTRE3G and (a) ABA-inducible or (b) GA-inducible VPR–Sp dCas9. (c,d) Fluorescence quantification after 5 d induction for HEK293T pSV40–EGFP cells transfected with Sp sgSV40 and (c) ABA-inducible or (d) GA-inducible Sp KRAB–dCas9. Inverse fold-change repression is indicated in magenta. (e,f) Fluorescence quantification after 48 h for HEK293T pTRE3G–EGFP cells transfected with Sa sgTRE3G and (e) ABA-inducible or (f) GA-inducible VPR-Sa dCas9. (g) Immunofluorescence quantification of CXCR4 after 48 h induction in HEK293T cells transfected with Sp sgCXCR4 and ABA-inducible dCas9 fused to a VPR, SunTag–VP64, or SunTag–VPR activation domain. For the no-sgRNA controls in (g), the data represent two independent transfections performed in technical replicates (n = 4); for other conditions in (g) and all other experiments, the data represent four independent transfections performed in technical replicates (n = 8). Mean fluorescence intensities are presented as arbitrary units (a.u.). P values from Games–Howell post hoc tests following Welch’s ANOVA are provided in supplementary Table 1.
Figure 2
Figure 2
Characterization of the dynamics and dose response of ABA-and GA-inducible gene activation. (a,b) 7-d timecourse for clonal HEK293T pTRE3G-EGFP cells stably expressing Sp or Sa sgTRE3G and (a) ABA-inducible or (b) GA-inducible VPR-Sp or Sa dCas9. Cells were continuously induced with 100 μM ABA or 10 μM GA for 7 d (ON7); induced for 2 d then cultured without inducer for 5 d (ON2 OFF5); or induced for 2 d, cultured without inducer for 3 d, then reinduced for 2 d (ON2 OFF3 ON2). The data are displayed as individual data points for two independent platings of a stable cell line (n = 2). (c,d) Dose response after 48 h induction for HEK293T pTRE3G–EGFP cells transfected with Sp or Sa sgTRE3G and (c) ABA-inducible or (d) GA-inducible VPR–Sp or Sa dCas9. The shaded regions indicate the approximate linear dose–response ranges. The data are displayed as mean ± s.d. for four independent transfections (n = 4).
Figure 3
Figure 3
Orthogonal gene regulation by independently inducible dCas9s. (a,b) Fluorescence quantifications for HEK293T pSV40-EGFP pTRE3G-mCherry dual reporter cells transfected with (a) direct fusion KRAB-Sp dCas9 and/or VPR-Sa dCas9 plus their respective sgRNAs or (b) ABA-inducible KRAB–Sp dCas9, GA-inducible VPR–Sa dCas9, and their respective sgRNAs. EGFP fluorescence is displayed for quantifications performed after 5 d induction, and mCherry fluorescence is displayed for quantifications performed after 48 h induction. Fold-change activation is indicated in black, while inverse fold-change repression is indicated in magenta. The data represent four independent transfections performed in technical replicates (n = 8). Dots represent individual data points. The different colors represent different treatment conditions: gray, no inducer; yellow, ABA; green, GA; blue, both ABA and GA. (c,d) Immunofluorescence quantifications for CXCR4 and CD95 after 48 h induction for HEK293T cells transiently transfected with (c) direct fusion KRAB–Sp dCas9, VPR–Sa dCas9, and sgRNAs or (d) GA-inducible VPR–Sp dCas9, ABA-inducible VPR–Sa dCas9, and sgRNAs and stained with APC-conjugated CXCR4 and PE-conjugated CD95 antibodies. Transfected sgRNAs consisted of three targeting sgRNAs (Sp sgCD95-1 to 3 or Sa sgCXCR4-1 to 3) per gene of interest or an equimolar amount of nontargeting sgRNA (Sp/Sa sgTRE3G). The data represent four independent transfections (n = 4). P values from Games-Howell post hoc tests following Welch’s ANOVA are provided in supplementary Table 1.
Figure 4
Figure 4
A multi-input CRISPR system for complex regulation of gene expression. (a,b) Fluorescence quantifications after 48 h induction for HEK293T pTRE3G–EGFP cells transiently transfected with Sp sgTRE3G and (a) the OR gate or (b) the AND gate VPR–Sp dCas9 construct. The dotted line represents the mean EGFP fluorescence in uninduced cells. The data represent four independent transfections performed in technical replicates (n = 8). (c) Schematic representation of inducibly recruiting opposing transcriptional effectors to a single dCas9. (d) Fluorescence quantifications after 5 d induction for HEK293T pSV40–EGFP cells transfected with the diametric Sp dCas9 construct and Sp sgSV40. Fold-change activation is indicated in black, while inverse fold-change repression is indicated in magenta. The data represent two independent transfections performed in technical replicates (n = 4). (e) 7-d inducer switch timecourse of HEK293T pSV40–EGFP cells stably expressing the diametric Sp dCas9 construct and Sp sgSV40. Cells were induced 2 d with 10 μM GA then replaced with 100 μM ABA for 5 d. Alternatively, cells were induced 5 d with 100 μM ABA then replaced with 10 μM GA for 2 d. The dotted line represents the mean EGFP fluorescence in uninduced cells. The data represent individual data points for two independent platings of a stable cell line (n = 2). P values from Games–Howell post hoc tests following Welch’s ANOVA are provided in supplementary Table 1.
Figure 5
Figure 5
Transcriptome engineering using orthogonal and inducible dCas9 regulators. Inducible dCas9 regulators can be used in combination in cells to achieve orthogonal and multiplexed transcriptome manipulation.

References

    1. Maurano MT, et al. Systematic localization of common disease-associated variation in regulatory DNA. Science. 2012;337:1190–1195. - PMC - PubMed
    1. Weinhold N, Jacobsen A, Schultz N, Sander C, Lee W. Genome-wide analysis of noncoding regulatory mutations in cancer. Nat Genet. 2014;46:1160–1165. - PMC - PubMed
    1. DeRisi JL, Iyer VR, Brown PO. Exploring the metabolic and genetic control of gene expression on a genomic scale. Science. 1997;278:680–686. - PubMed
    1. Nagalakshmi U, et al. The transcriptional landscape of the yeast genome defined by RNA sequencing. Science. 2008;320:1344–1349. - PMC - PubMed
    1. Loew R, Heinz N, Hampf M, Bujard H, Gossen M. Improved Tet-responsive promoters with minimized background expression. BMC Biotechnol. 2010;10:81. - PMC - PubMed

MeSH terms

Substances