The COX- inhibitor indomethacin reduces Th1 effector and T regulatory cells in vitro in Mycobacterium tuberculosis infection
- PMID: 27776487
- PMCID: PMC5078976
- DOI: 10.1186/s12879-016-1938-8
The COX- inhibitor indomethacin reduces Th1 effector and T regulatory cells in vitro in Mycobacterium tuberculosis infection
Abstract
Background: Tuberculosis (TB) causes a major burden on global health with long and cumbersome TB treatment regimens. Host-directed immune modulating therapies have been suggested as adjunctive treatment to TB antibiotics. Upregulated cyclooxygenase-2 (COX-2)-prostaglandin E2 (PGE2) signaling pathway may cause a dysfunctional immune response that favors survival and replication of Mycobacterium tuberculosis (Mtb).
Methods: Blood samples were obtained from patients with latent TB (n = 9) and active TB (n = 33) before initiation of anti-TB chemotherapy. COX-2 expression in monocytes and ESAT-6 and Ag85 specific T cell cytokine responses (TNF-α, IFN-γ, IL-2), proliferation (carboxyfluorescein succinimidyl ester staining) and regulation (FOXP3+ T regulatory cells) were analysed by flow cytometry and the in vitro effects of the COX-1/2 inhibitor indomethacin were measured.
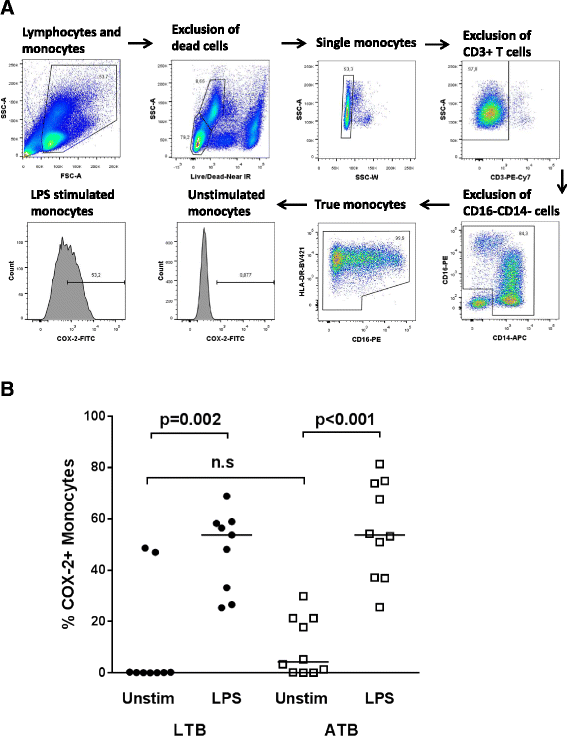
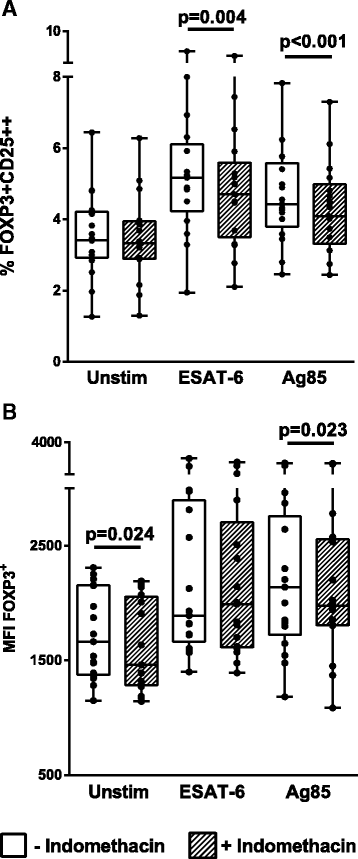
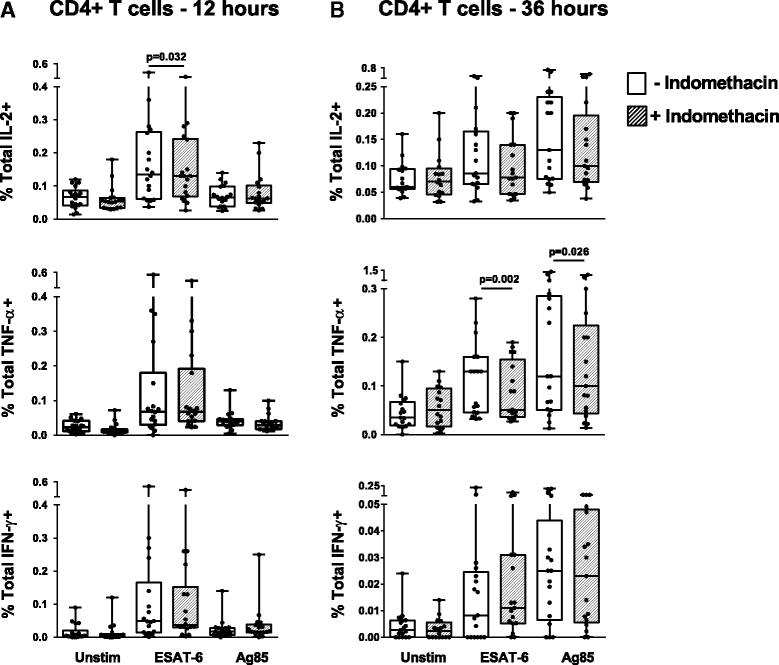
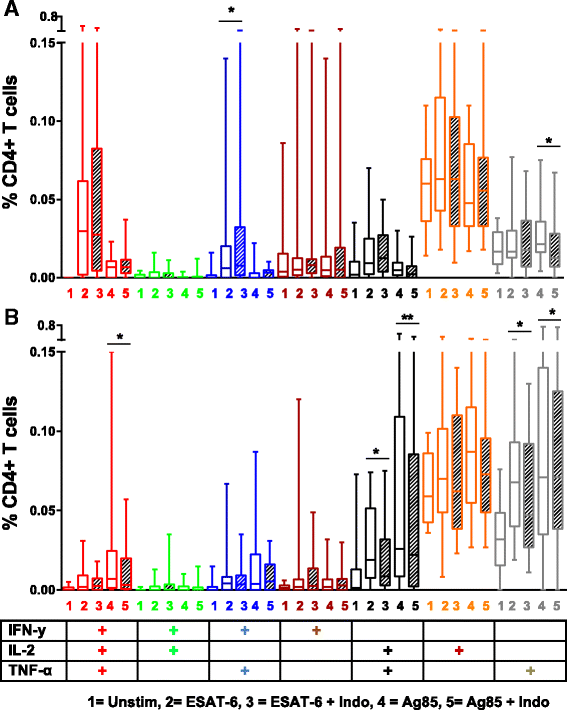
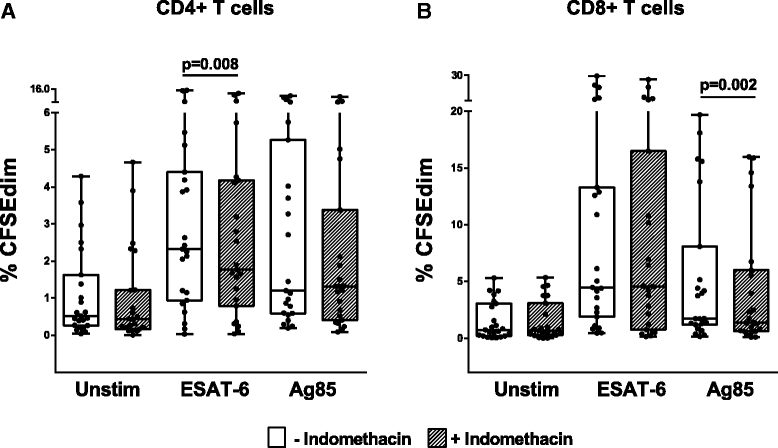
Results: We demonstrate that indomethacin significantly down-regulates the fraction of Mtb specific FOXP3+ T regulatory cells (ESAT-6; p = 0.004 and Ag85; p < 0.001) with a concomitant reduction of Mtb specific cytokine responses and T cell proliferation in active TB. Although active TB tend to have higher levels, there are no significant differences in COX-2 expression between unstimulated monocytes from patients with active TB compared to latent infection. Monocytes in both TB groups respond with a significant upregulation of COX-2 after in vitro stimulation.
Conclusions: Taken together, our in vitro data indicate a modulation of the Th1 effector and T regulatory cells in Mtb infection in response to the COX-1/2 inhibitor indomethacin. The potential role as adjunctive host-directed therapy in TB disease should be further evaluated in both animal studies and in human clinical trials.
Keywords: COX-inhibitors; Cytokines; Host-directed therapy; Monocytes; Regulatory T cells; Tregs; Tuberculosis.
Figures

Similar articles
-
T Cell Responses and Regulation and the Impact of In Vitro IL-10 and TGF-β Modulation During Treatment of Active Tuberculosis.Scand J Immunol. 2017 Feb;85(2):138-146. doi: 10.1111/sji.12511. Scand J Immunol. 2017. PMID: 27862137
-
Biomarkers for discrimination between latent tuberculosis infection and active tuberculosis disease.J Infect. 2017 Mar;74(3):281-293. doi: 10.1016/j.jinf.2016.11.010. Epub 2016 Nov 19. J Infect. 2017. PMID: 27871809
-
Early dynamics of T helper cell cytokines and T regulatory cells in response to treatment of active Mycobacterium tuberculosis infection.Clin Exp Immunol. 2015 Mar;179(3):454-65. doi: 10.1111/cei.12468. Clin Exp Immunol. 2015. PMID: 25313008 Free PMC article.
-
Functional Signatures of Human CD4 and CD8 T Cell Responses to Mycobacterium tuberculosis.Front Immunol. 2014 Apr 22;5:180. doi: 10.3389/fimmu.2014.00180. eCollection 2014. Front Immunol. 2014. PMID: 24795723 Free PMC article. Review.
-
[Evolution of IGRA researches].Kekkaku. 2008 Sep;83(9):641-52. Kekkaku. 2008. PMID: 18979999 Review. Japanese.
Cited by
-
Paradoxical manifestations during tuberculous meningitis treatment among HIV-negative patients: a retrospective descriptive study and literature review.Neurol Sci. 2022 Apr;43(4):2699-2708. doi: 10.1007/s10072-021-05693-2. Epub 2021 Oct 27. Neurol Sci. 2022. PMID: 34705128 Review.
-
Cyclooxygenase inhibitors impair CD4 T cell immunity and exacerbate Mycobacterium tuberculosis infection in aerosol-challenged mice.Commun Biol. 2019 Aug 5;2:288. doi: 10.1038/s42003-019-0530-3. eCollection 2019. Commun Biol. 2019. PMID: 31396568 Free PMC article.
-
Host-Directed Therapeutic Strategies for Tuberculosis.Front Med (Lausanne). 2017 Oct 18;4:171. doi: 10.3389/fmed.2017.00171. eCollection 2017. Front Med (Lausanne). 2017. PMID: 29094039 Free PMC article. Review.
-
PGE2 displays immunosuppressive effects during human active tuberculosis.Sci Rep. 2021 Jun 30;11(1):13559. doi: 10.1038/s41598-021-92667-1. Sci Rep. 2021. PMID: 34193890 Free PMC article. Clinical Trial.
-
Prostaglandin E2 as a Regulator of Immunity to Pathogens.Pharmacol Ther. 2018 May;185:135-146. doi: 10.1016/j.pharmthera.2017.12.008. Epub 2017 Dec 22. Pharmacol Ther. 2018. PMID: 29274705 Free PMC article. Review.
References
-
- World health organization (WHO). Global Tuberculosis report 2015. Available at: http://www.who.int/tb/publications/global_report/en/. (Accessed 2 Dec 2015).
MeSH terms
Substances
LinkOut - more resources
Full Text Sources
Other Literature Sources
Medical
Research Materials

