Australian black field crickets show changes in neural gene expression associated with socially-induced morphological, life-history, and behavioral plasticity
- PMID: 27776492
- PMCID: PMC5078956
- DOI: 10.1186/s12864-016-3119-y
Australian black field crickets show changes in neural gene expression associated with socially-induced morphological, life-history, and behavioral plasticity
Abstract
Background: Ecological and evolutionary model organisms have provided extensive insight into the ecological triggers, adaptive benefits, and evolution of life-history driven developmental plasticity. Despite this, we still have a poor understanding of the underlying genetic changes that occur during shifts towards different developmental trajectories. The goal of this study is to determine whether we can identify underlying gene expression patterns that can describe the different life-history trajectories individuals follow in response to social cues of competition. To do this, we use the Australian black field cricket (Teleogryllus commodus), a species with sex-specific developmental trajectories moderated by the density and quality of calls heard during immaturity. In this study, we manipulated the social information males and females could hear by rearing individuals in either calling or silent treatments. We next used RNA-Seq to develop a reference transcriptome to study changes in brain gene expression at two points prior to sexual maturation.
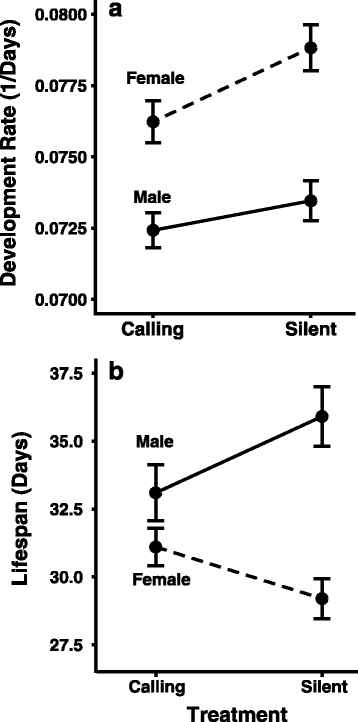
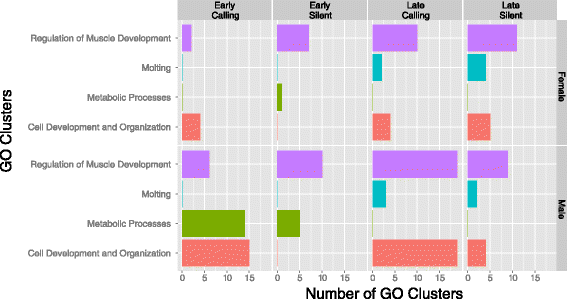
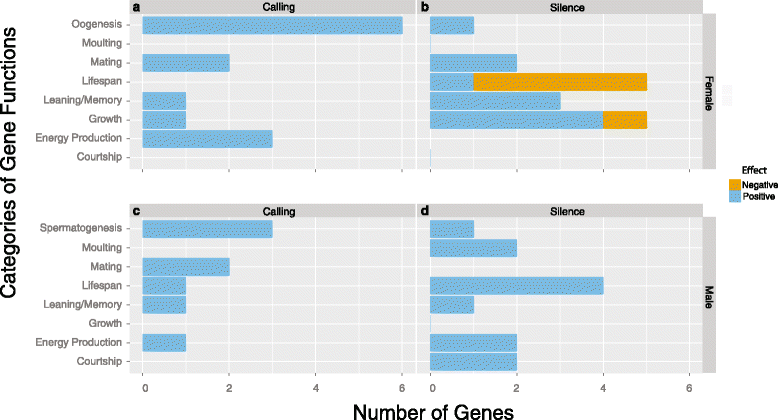
Results: We show accelerated development in both sexes when exposed to calling; changes were also seen in growth, lifespan, and reproductive effort. Functional relationships between genes and phenotypes were apparent from ontological enrichment analysis. We demonstrate that increased investment towards traits such as growth and reproductive effort were often associated with the expression of a greater number of genes with similar effect, thus providing a suite of candidate genes for future research in this and other invertebrate organisms.
Conclusions: Our results provide interesting insight into the genomic underpinnings of developmental plasticity and highlight the potential of a genomic exploration of other evolutionary theories such as condition dependence and sex-specific developmental strategies.
Keywords: Behaviour; Black field cricket; Developmental plasticity; Gene expression; Sexual selection; Teleogryllus commodus; Transcriptome analysis.
Figures
Similar articles
-
Sexual signal loss: The link between behaviour and rapid evolutionary dynamics in a field cricket.J Anim Ecol. 2018 May;87(3):623-633. doi: 10.1111/1365-2656.12806. Epub 2018 Mar 5. J Anim Ecol. 2018. PMID: 29417997
-
Sounds different: inbreeding depression in sexually selected traits in the cricket Teleogryllus commodus.J Evol Biol. 2007 May;20(3):1138-47. doi: 10.1111/j.1420-9101.2006.01286.x. J Evol Biol. 2007. PMID: 17465923
-
Acoustic experience shapes alternative mating tactics and reproductive investment in male field crickets.Curr Biol. 2010 May 11;20(9):845-9. doi: 10.1016/j.cub.2010.02.063. Epub 2010 Apr 22. Curr Biol. 2010. PMID: 20417103
-
Sexual dimorphism in cuticular hydrocarbons of the Australian field cricket Teleogryllus oceanicus (Orthoptera: Gryllidae).J Insect Physiol. 2008 Jun;54(6):1081-9. doi: 10.1016/j.jinsphys.2008.04.012. Epub 2008 Apr 22. J Insect Physiol. 2008. PMID: 18519139 Review.
-
The Cricket Gryllus bimaculatus: Techniques for Quantitative and Functional Genetic Analyses of Cricket Biology.Results Probl Cell Differ. 2019;68:183-216. doi: 10.1007/978-3-030-23459-1_8. Results Probl Cell Differ. 2019. PMID: 31598857 Review.
Cited by
-
Development rate rather than social environment influences cognitive performance in Australian black field crickets, Teleogryllus commodus.PeerJ. 2017 Jul 14;5:e3563. doi: 10.7717/peerj.3563. eCollection 2017. PeerJ. 2017. PMID: 28717598 Free PMC article.
-
Transcriptome analysis of life stages of the house cricket, Acheta domesticus, to improve insect crop production.Sci Rep. 2020 Feb 26;10(1):3471. doi: 10.1038/s41598-020-59087-z. Sci Rep. 2020. PMID: 32103047 Free PMC article.
-
Socially cued seminal fluid gene expression mediates responses in ejaculate quality to sperm competition risk.Proc Biol Sci. 2017 Aug 30;284(1861):20171486. doi: 10.1098/rspb.2017.1486. Proc Biol Sci. 2017. PMID: 28855372 Free PMC article.
References
-
- West-Eberhard MJ. Developmental plasticity and evolution. New York: Oxford University Press; 2003.
-
- Loman J. Early metamorphosis in common frog Rana temporaria tadpoles at risk of drying: An experimental demonstration. Amphibia-Reptilia. 1999;20:421–430. doi: 10.1163/156853899X00466. - DOI
-
- Kasumovic MM: The multidimensional consequences of the juvenile environment: towards an integrative view of the adult phenotype Anim Behav 2013:In Press.
-
- Pigliucci M. Phenotypic plasticity: beyond nature and nurture. Baltimore, MD: John Hopkins University Press; 2001.
Publication types
MeSH terms
LinkOut - more resources
Full Text Sources
Other Literature Sources

