

Mammographically dense human breast tissue stimulates MCF10DCIS.com progression to invasive lesions and metastasis
- PMID: 27776557
- PMCID: PMC5078949
- DOI: 10.1186/s13058-016-0767-4
Mammographically dense human breast tissue stimulates MCF10DCIS.com progression to invasive lesions and metastasis
Abstract
Background: High mammographic density (HMD) not only confers a significantly increased risk of breast cancer (BC) but also is associated with BCs of more advanced stages. However, it is unclear whether BC progression and metastasis are stimulated by HMD. We investigated whether patient-derived HMD breast tissue could stimulate the progression of MCF10DCIS.com cells compared with patient-matched low mammographic density (LMD) tissue.
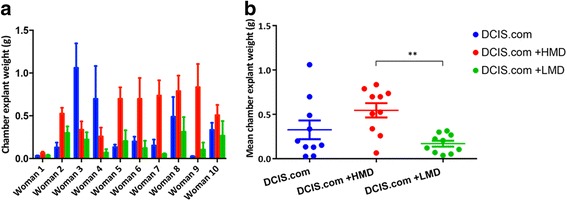
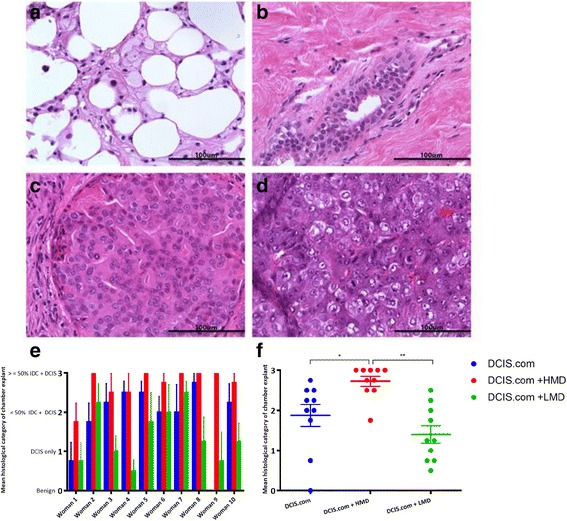
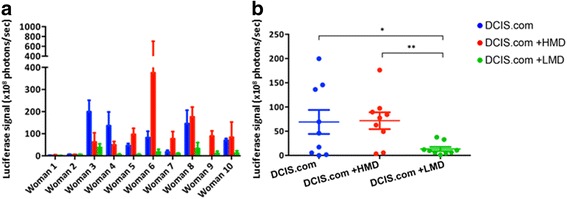
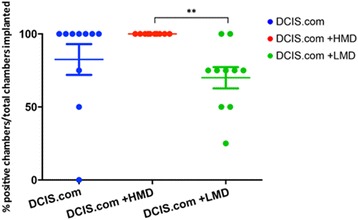
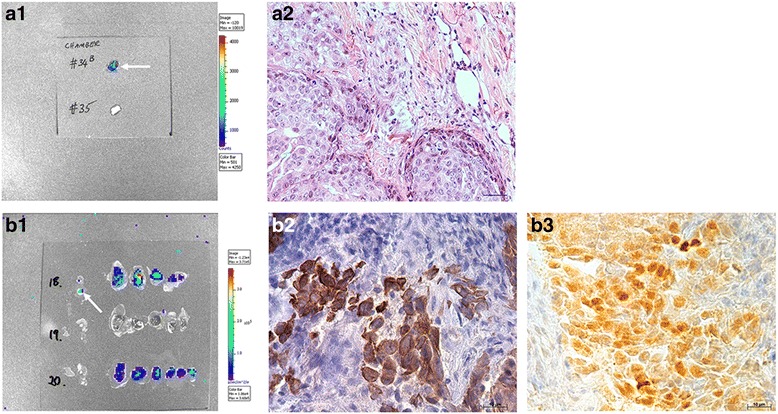
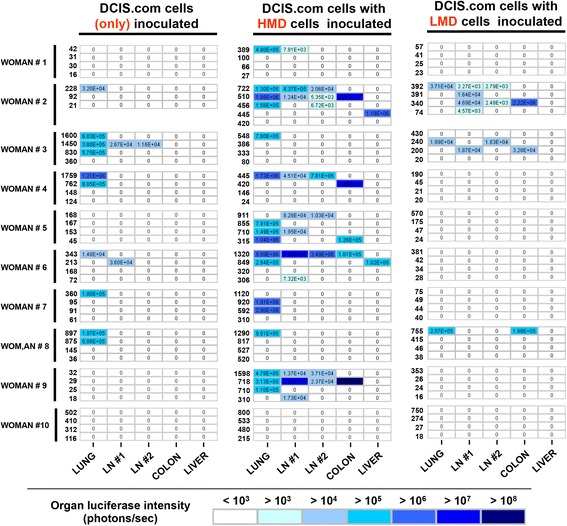
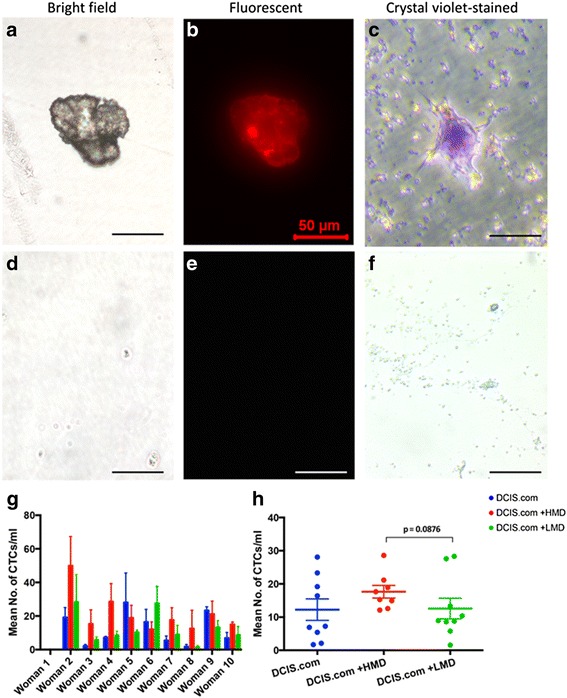
Methods: Sterile breast specimens were obtained immediately after prophylactic mastectomy from high-risk women (n = 10). HMD and LMD regions of each specimen were resected under radiological guidance. Human MCF10DCIS.com cells, a model of ductal carcinoma in situ (DCIS), were implanted into silicone biochambers in the groins of severe combined immunodeficiency mice, either alone or with matched LMD or HMD tissue (1:1), and maintained for 6 weeks. We assessed biochamber weight as a measure of primary tumour growth, histological grade of the biochamber material, circulating tumour cells and metastatic burden by luciferase and histology. All statistical tests were two-sided.
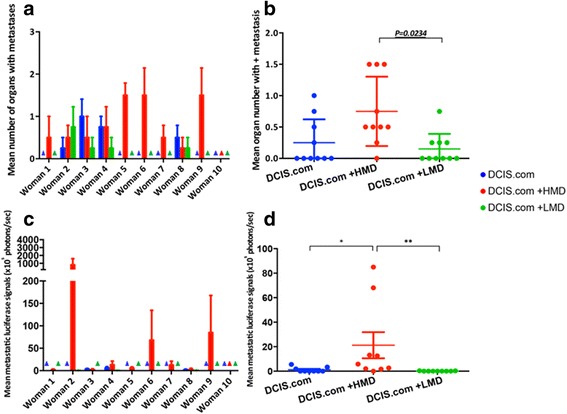
Results: HMD breast tissue led to increased primary tumour take, increased biochamber weight and increased proportions of high-grade DCIS and grade 3 invasive BCs compared with LMD. This correlated with an increased metastatic burden in the mice co-implanted with HMD tissue.
Conclusions: Our study is the first to explore the direct effect of HMD and LMD human breast tissue on the progression and dissemination of BC cells in vivo. The results suggest that HMD status should be a consideration in decision-making for management of patients with DCIS lesions.
Keywords: Breast cancer; MCF10DCIS.com; Mammographic density; Murine biochamber.
Figures
Similar articles
-
A review of the influence of mammographic density on breast cancer clinical and pathological phenotype.Breast Cancer Res Treat. 2019 Sep;177(2):251-276. doi: 10.1007/s10549-019-05300-1. Epub 2019 Jun 8. Breast Cancer Res Treat. 2019. PMID: 31177342 Review.
-
High mammographic density is associated with an increase in stromal collagen and immune cells within the mammary epithelium.Breast Cancer Res. 2015 Jun 4;17(1):79. doi: 10.1186/s13058-015-0592-1. Breast Cancer Res. 2015. PMID: 26040322 Free PMC article.
-
Effects of Tamoxifen and oestrogen on histology and radiographic density in high and low mammographic density human breast tissues maintained in murine tissue engineering chambers.Breast Cancer Res Treat. 2014 Nov;148(2):303-14. doi: 10.1007/s10549-014-3169-2. Epub 2014 Oct 21. Breast Cancer Res Treat. 2014. PMID: 25332094
-
High mammographic density in women is associated with protumor inflammation.Breast Cancer Res. 2018 Aug 9;20(1):92. doi: 10.1186/s13058-018-1010-2. Breast Cancer Res. 2018. PMID: 30092832 Free PMC article.
-
The management of ductal carcinoma in situ (DCIS). The Steering Committee on Clinical Practice Guidelines for the Care and Treatment of Breast Cancer. Canadian Association of Radiation Oncologists.CMAJ. 1998 Feb 10;158 Suppl 3:S27-34. CMAJ. 1998. PMID: 9484276 Review.
Cited by
-
The origins of breast cancer associated with mammographic density: a testable biological hypothesis.Breast Cancer Res. 2018 Mar 7;20(1):17. doi: 10.1186/s13058-018-0941-y. Breast Cancer Res. 2018. PMID: 29514672 Free PMC article.
-
RASSF1A Suppression as a Potential Regulator of Mechano-Pathobiology Associated with Mammographic Density in BRCA Mutation Carriers.Cancers (Basel). 2021 Jun 29;13(13):3251. doi: 10.3390/cancers13133251. Cancers (Basel). 2021. PMID: 34209669 Free PMC article.
-
Collagen-I influences the post-translational regulation, binding partners and role of Annexin A2 in breast cancer progression.Front Oncol. 2023 Oct 24;13:1270436. doi: 10.3389/fonc.2023.1270436. eCollection 2023. Front Oncol. 2023. PMID: 37941562 Free PMC article.
-
A review of the influence of mammographic density on breast cancer clinical and pathological phenotype.Breast Cancer Res Treat. 2019 Sep;177(2):251-276. doi: 10.1007/s10549-019-05300-1. Epub 2019 Jun 8. Breast Cancer Res Treat. 2019. PMID: 31177342 Review.
-
Mammographic Breast Density at Breast Cancer Diagnosis and Breast Cancer-Specific Survival.Diagnostics (Basel). 2024 Oct 25;14(21):2382. doi: 10.3390/diagnostics14212382. Diagnostics (Basel). 2024. PMID: 39518350 Free PMC article.
References
-
- Mullooly M, Pfeiffer RM, Nyante SJ, Heckman-Stoddard BM, Perloff M, Jatoi I, et al. Mammographic density as a biosensor of tamoxifen effectiveness in adjuvant endocrine treatment of breast cancer: opportunities and implications. J Clin Oncol. 2016;34(18):2093–2097. doi: 10.1200/JCO.2015.64.4492. - DOI - PMC - PubMed
Publication types
MeSH terms
Substances
LinkOut - more resources
Full Text Sources
Other Literature Sources
Medical
