

The geography of imported malaria to non-endemic countries: a meta-analysis of nationally reported statistics
- PMID: 27777030
- PMCID: PMC5392593
- DOI: 10.1016/S1473-3099(16)30326-7
The geography of imported malaria to non-endemic countries: a meta-analysis of nationally reported statistics
Abstract
Background: Malaria remains a problem for many countries classified as malaria free through cases imported from endemic regions. Imported cases to non-endemic countries often result in delays in diagnosis, are expensive to treat, and can sometimes cause secondary local transmission. The movement of malaria in endemic countries has also contributed to the spread of drug resistance and threatens long-term eradication goals. Here we focused on quantifying the international movements of malaria to improve our understanding of these phenomena and facilitate the design of mitigation strategies.
Methods: In this meta-analysis, we studied the database of publicly available nationally reported statistics on imported malaria in the past 10 years, covering more than 50 000 individual cases. We obtained data from 40 non-endemic countries and recorded the geographical variations.
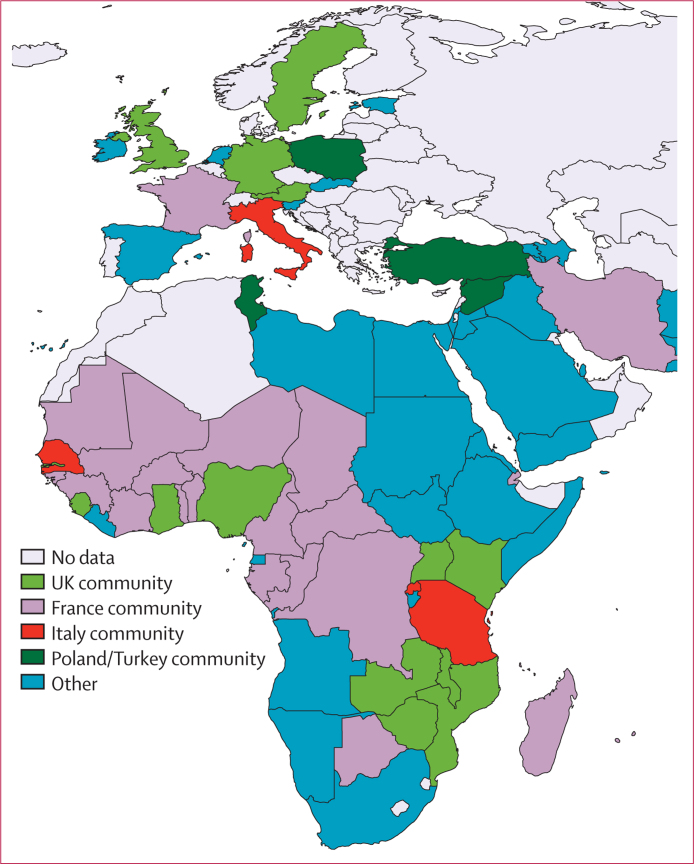
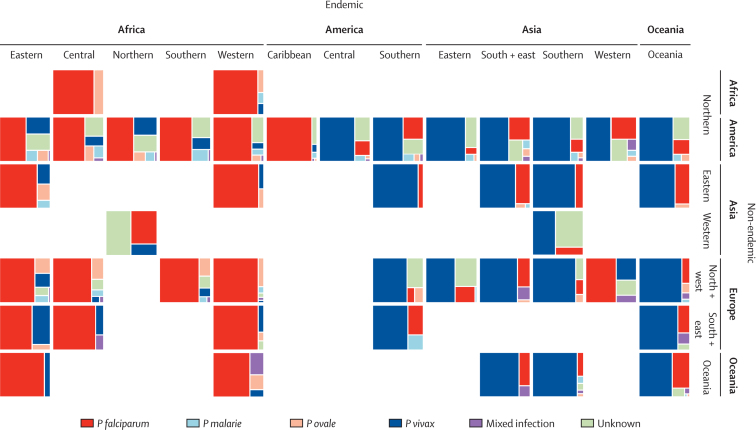
Findings: Infection movements were strongly skewed towards a small number of high-traffic routes between 2005 and 2015, with the west Africa region accounting for 56% (13 947/24 941) of all imported cases to non-endemic countries with a reported travel destination, and France and the UK receiving the highest number of cases, with more than 4000 reported cases per year on average. Countries strongly linked by movements of imported cases are grouped by historical, language, and travel ties. There is strong spatial clustering of plasmodium species types.
Interpretation: The architecture of the air network, historical ties, demographics of travellers, and malaria endemicity contribute to highly heterogeneous patterns of numbers, routes, and species compositions of parasites transported. With global malaria eradication on the international agenda, malaria control altering local transmission, and the threat of drug resistance, understanding these patterns and their drivers is increasing in importance.
Funding: Bill & Melinda Gates Foundation, National Institutes of Health, UK Medical Research Council, UK Department for International Development, Wellcome Trust.
Copyright © 2017 The Author(s). Published by Elsevier Ltd. This is an Open Access article under the CC BY license. Published by Elsevier Ltd.. All rights reserved.
Figures


Comment in
-
Global malaria importations.Lancet Infect Dis. 2017 Jan;17(1):11-12. doi: 10.1016/S1473-3099(16)30404-2. Epub 2016 Oct 21. Lancet Infect Dis. 2017. PMID: 27777029 No abstract available.
-
Underestimate of annual malaria imports to Canada.Lancet Infect Dis. 2017 Feb;17(2):141-142. doi: 10.1016/S1473-3099(17)30010-5. Lancet Infect Dis. 2017. PMID: 28134112 No abstract available.
-
Underestimate of annual malaria imports to Canada - Author reply.Lancet Infect Dis. 2017 Feb;17(2):142-143. doi: 10.1016/S1473-3099(17)30025-7. Lancet Infect Dis. 2017. PMID: 28134114 No abstract available.
References
-
- WHO . Global technical strategy for malaria 2016–2030. World Health Organization; Geneva: 2015.
-
- Freedman DO, Weld LH, Kozarsky PE. Spectrum of disease and relation to place of exposure among ill returned travelers. N Engl J Med. 2006;354:119–130. - PubMed
-
- Hanscheid T. Current strategies to avoid misdiagnosis of malaria. Clin Microbiol Infect. 2003;9:497–504. - PubMed
Publication types
MeSH terms
Grants and funding
LinkOut - more resources
Full Text Sources
Other Literature Sources
Medical
Miscellaneous
