

Focal osteoporosis defects play a key role in hip fracture
- PMID: 27777119
- PMCID: PMC5135225
- DOI: 10.1016/j.bone.2016.10.020
Focal osteoporosis defects play a key role in hip fracture
Abstract
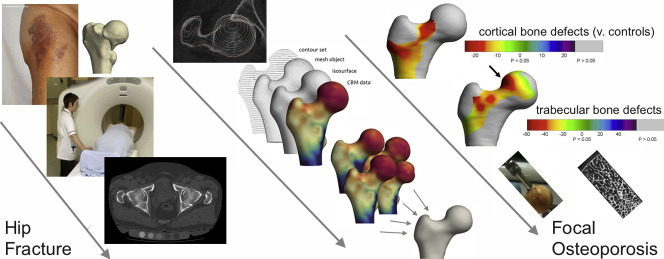
Background: Hip fractures are mainly caused by accidental falls and trips, which magnify forces in well-defined areas of the proximal femur. Unfortunately, the same areas are at risk of rapid bone loss with ageing, since they are relatively stress-shielded during walking and sitting. Focal osteoporosis in those areas may contribute to fracture, and targeted 3D measurements might enhance hip fracture prediction. In the FEMCO case-control clinical study, Cortical Bone Mapping (CBM) was applied to clinical computed tomography (CT) scans to define 3D cortical and trabecular bone defects in patients with acute hip fracture compared to controls. Direct measurements of trabecular bone volume were then made in biopsies of target regions removed at operation.
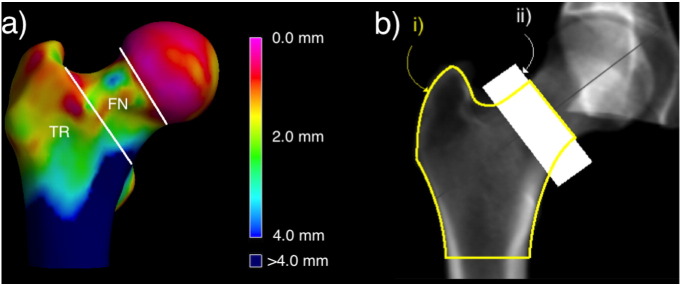
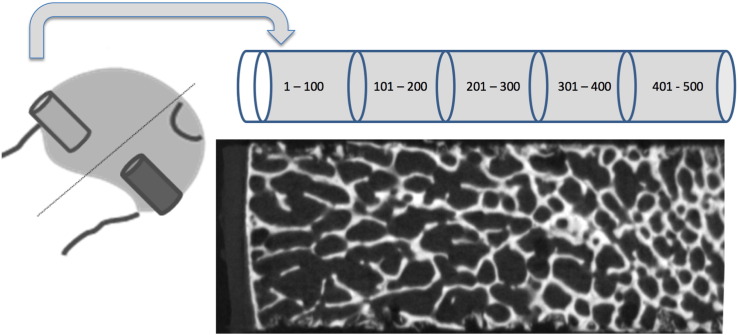
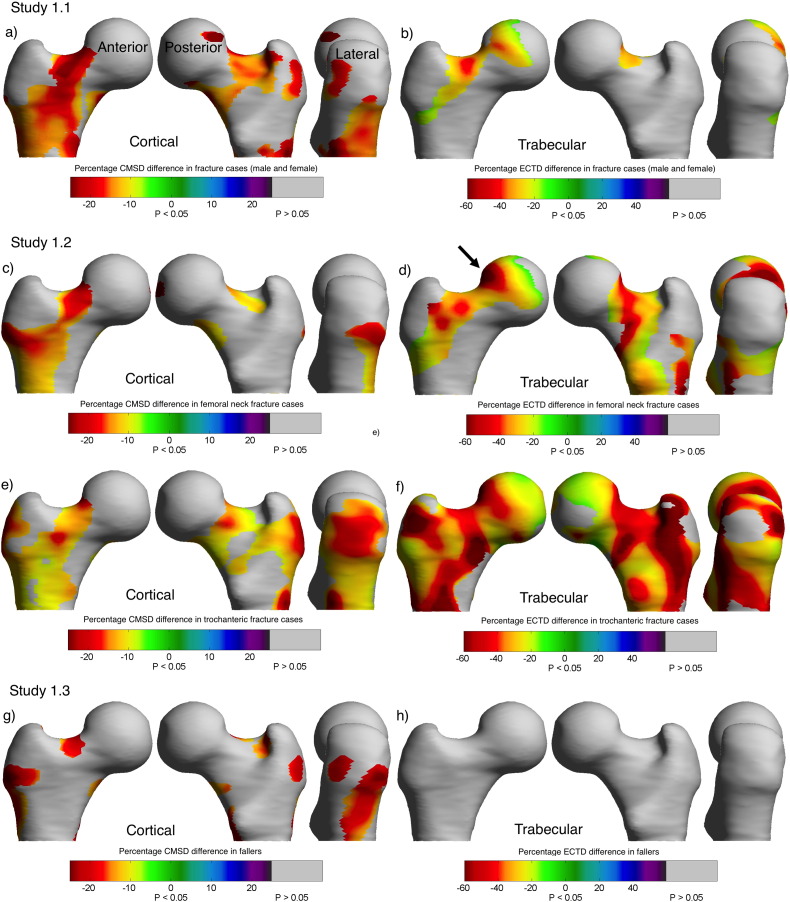
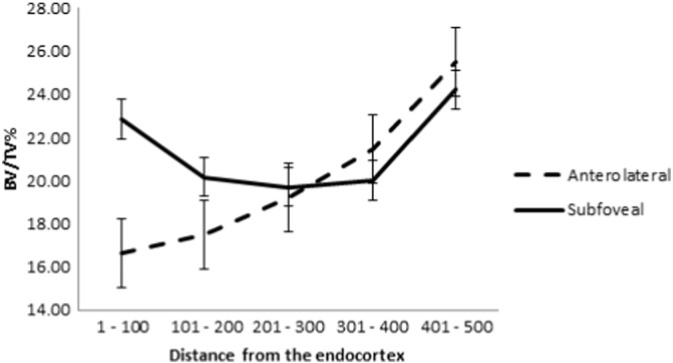
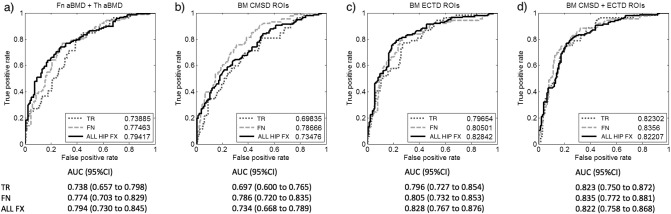
Methods: The sample consisted of CT scans from 313 female and 40 male volunteers (158 with proximal femoral fracture, 145 age-matched controls and 50 fallers without hip fracture). Detailed Cortical Bone Maps (c.5580 measurement points on the unfractured hip) were created before registering each hip to an average femur shape to facilitate statistical parametric mapping (SPM). Areas where cortical and trabecular bone differed from controls were visualised in 3D for location, magnitude and statistical significance. Measures from the novel regions created by the SPM process were then tested for their ability to classify fracture versus control by comparison with traditional CT measures of areal Bone Mineral Density (aBMD). In women we used the surgical classification of fracture location ('femoral neck' or 'trochanteric') to discover whether focal osteoporosis was specific to fracture type. To explore whether the focal areas were osteoporotic by histological criteria, we used micro CT to measure trabecular bone parameters in targeted biopsies taken from the femoral heads of 14 cases.
Results: Hip fracture patients had distinct patterns of focal osteoporosis that determined fracture type, and CBM measures classified fracture type better than aBMD parameters. CBM measures however improved only minimally on aBMD for predicting any hip fracture and depended on the inclusion of trabecular bone measures alongside cortical regions. Focal osteoporosis was confirmed on biopsy as reduced sub-cortical trabecular bone volume.
Conclusion: Using 3D imaging methods and targeted bone biopsy, we discovered focal osteoporosis affecting trabecular and cortical bone of the proximal femur, among men and women with hip fracture.
Keywords: Fracture prediction; Hip fracture; Osteoporosis; Pathogenesis.
Copyright © 2016 The Authors. Published by Elsevier Inc. All rights reserved.
Figures
References
-
- Clinical Guideline (CG124) Excellence NIfHaC. 2011. The management of hip fracture in adults. ed. London.
-
- Pulkkinen P., Gluer C.C., Jamsa T. Investigation of differences between hip fracture types: a worthy strategy for improved risk assessment and fracture prevention. Bone. 2011;49:600–604. - PubMed
-
- Juszczyk M.M., Cristofolini L., Salva M., Zani L., Schileo E., Viceconti M. Accurate in vitro identification of fracture onset in bones: failure mechanism of the proximal human femur. J. Biomech. 2013;46:158–164. - PubMed
Publication types
MeSH terms
Grants and funding
LinkOut - more resources
Full Text Sources
Other Literature Sources
Medical
