

Aging dysregulates D- and E-series resolvins to modulate cardiosplenic and cardiorenal network following myocardial infarction
- PMID: 27777380
- PMCID: PMC5191859
- DOI: 10.18632/aging.101077
Aging dysregulates D- and E-series resolvins to modulate cardiosplenic and cardiorenal network following myocardial infarction
Abstract
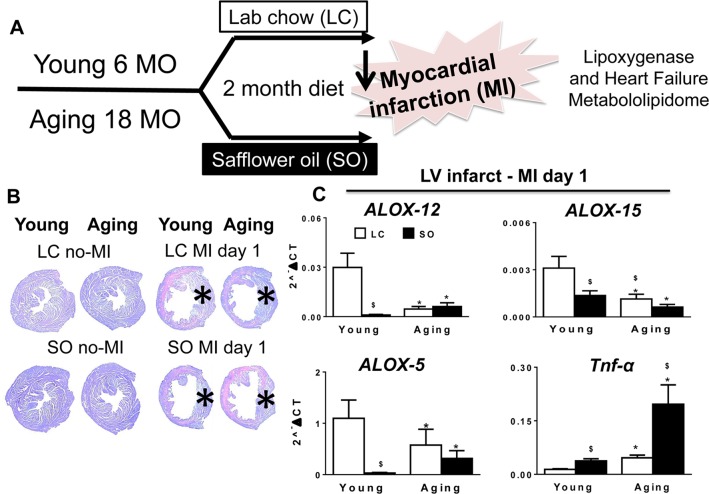
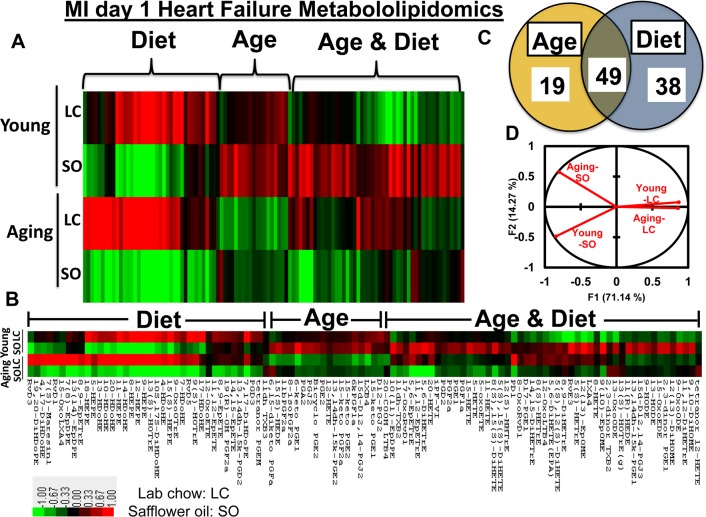
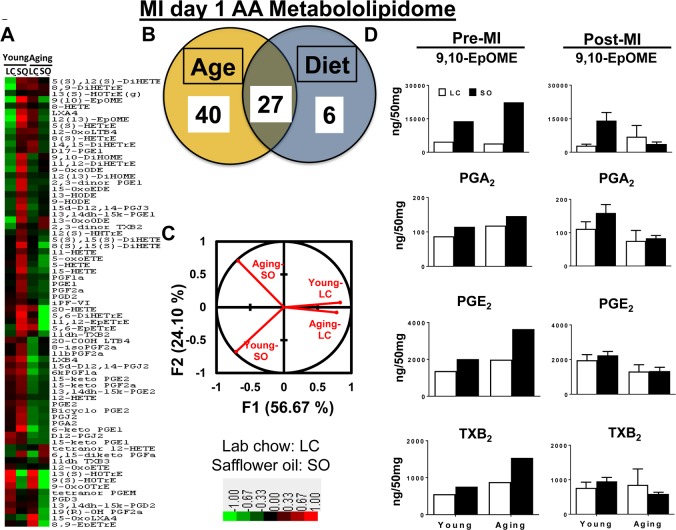
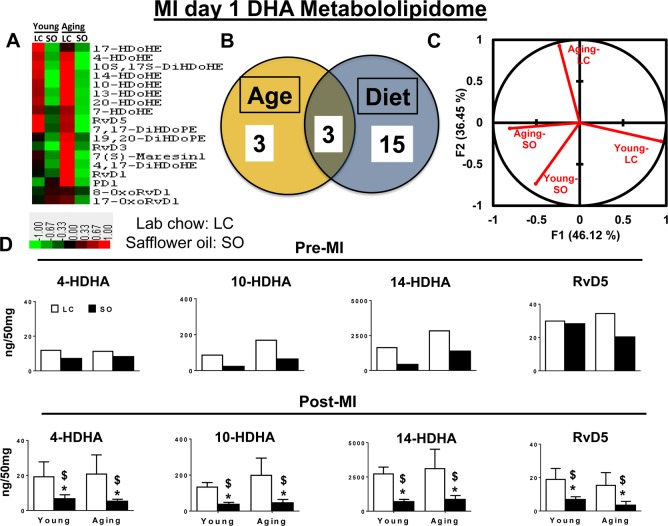
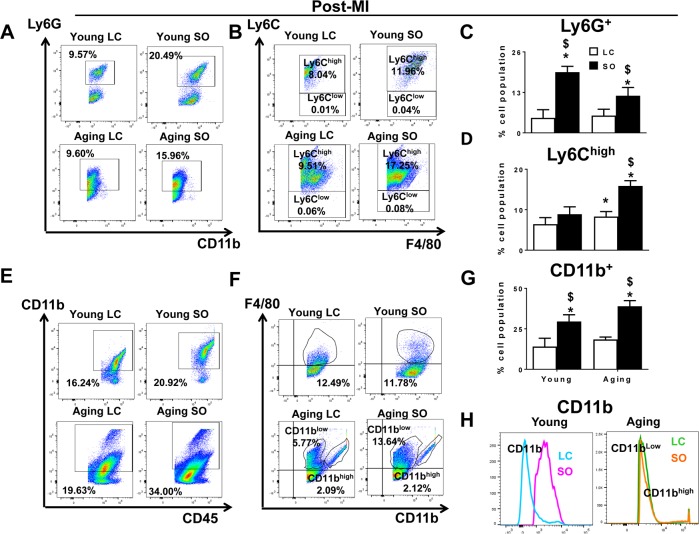
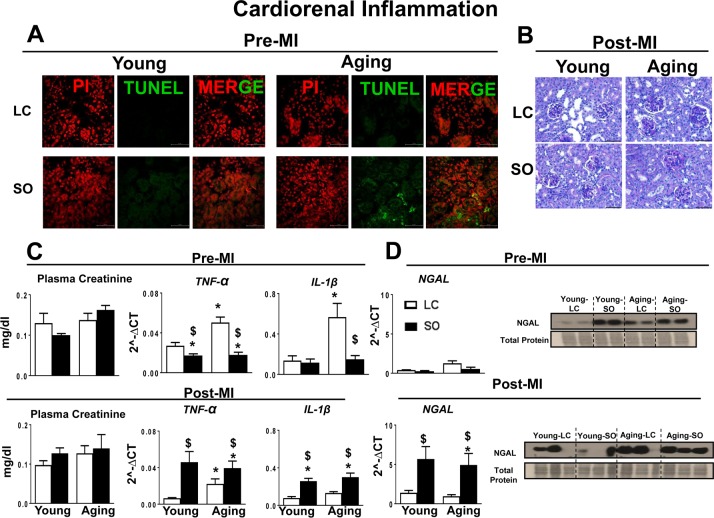
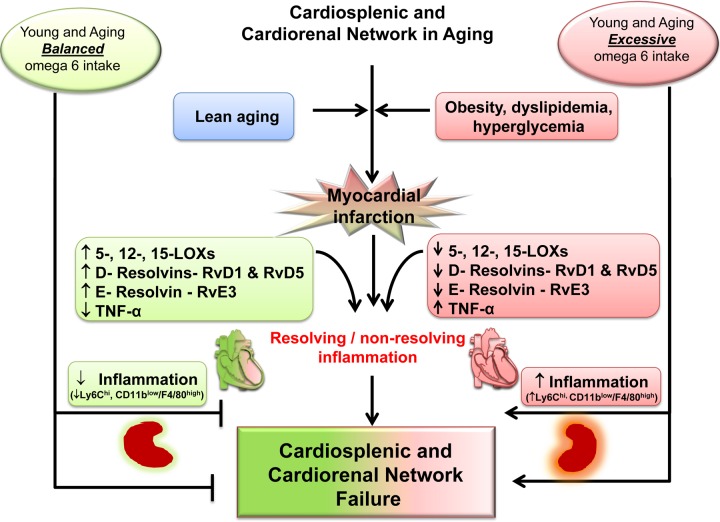
Post-myocardial infarction (MI), overactive inflammation is the hallmark of aging, however, the mechanism is unclear. We hypothesized that excess influx of omega 6 fatty acids may impair resolution, thus impacting the cardiosplenic and cardiorenal network post-MI. Young and aging mice were fed on standard lab chow (LC) and excess fatty acid (safflower oil; SO)-enriched diet for 2 months and were then subjected to MI surgery. Despite similar infarct areas and left ventricle (LV) dysfunction post-MI, splenic mass spectrometry data revealed higher levels of arachidonic acid (AA) derived pro-inflammatory metabolites in young-SO, but minimal formation of docosanoids, D- and E- series resolvins in SO-fed aged mice. The aged mice receiving excess intake of fatty acids exhibit; 1) decreased lipoxygenases (5-,12-, and 15) in the infarcted LV; 2) lower levels of 14HDHA, RvD1, RvD5, protectin D1, 7(S)maresin1, 8-,11-,18-HEPE and RvE3 with high levels of tetranor-12-HETEs; 3) dual population of macrophages (CD11blow/F480high and CD11bhigh/F480high) with increased pro-inflammatory (CD11bp+F4/80+Ly6Chi) phenotype and; 4) increased kidney injury marker NGAL with increased expression of TNF-α and IL-1β indicating MI-induced non-resolving response compared with LC-group. Thus, excess fatty acid intake magnifies the post-MI chemokine signaling and inflames the cardiosplenic and cardiorenal network towards a non-resolving microenvironment in aging.
Keywords: aging; lipid mediators; lipoxygenase; macrophages; myocardial infarction; non-resolving inflammation.
Conflict of interest statement
The authors have no conflict of interests to declare.
Figures
Similar articles
-
Immune responsive resolvin D1 programs myocardial infarction-induced cardiorenal syndrome in heart failure.FASEB J. 2018 Jul;32(7):3717-3729. doi: 10.1096/fj.201701173RR. Epub 2018 Feb 13. FASEB J. 2018. PMID: 29455574 Free PMC article.
-
Obesity superimposed on aging magnifies inflammation and delays the resolving response after myocardial infarction.Am J Physiol Heart Circ Physiol. 2015 Feb 15;308(4):H269-80. doi: 10.1152/ajpheart.00604.2014. Epub 2014 Dec 5. Am J Physiol Heart Circ Physiol. 2015. PMID: 25485899 Free PMC article.
-
Resolvin D1 activates the inflammation resolving response at splenic and ventricular site following myocardial infarction leading to improved ventricular function.J Mol Cell Cardiol. 2015 Jul;84:24-35. doi: 10.1016/j.yjmcc.2015.04.003. Epub 2015 Apr 11. J Mol Cell Cardiol. 2015. PMID: 25870158 Free PMC article.
-
Omega-3 fatty acids and their lipid mediators: towards an understanding of resolvin and protectin formation.Prostaglandins Other Lipid Mediat. 2012 Mar;97(3-4):73-82. doi: 10.1016/j.prostaglandins.2012.01.005. Epub 2012 Feb 3. Prostaglandins Other Lipid Mediat. 2012. PMID: 22326554 Review.
-
Lipidomic profiling of bioactive lipids by mass spectrometry during microbial infections.Semin Immunol. 2013 Oct 31;25(3):240-8. doi: 10.1016/j.smim.2013.08.006. Epub 2013 Sep 29. Semin Immunol. 2013. PMID: 24084369 Free PMC article. Review.
Cited by
-
Doxorubicin triggers splenic contraction and irreversible dysregulation of COX and LOX that alters the inflammation-resolution program in the myocardium.Am J Physiol Heart Circ Physiol. 2018 Nov 1;315(5):H1091-H1100. doi: 10.1152/ajpheart.00290.2018. Epub 2018 Aug 3. Am J Physiol Heart Circ Physiol. 2018. PMID: 30074834 Free PMC article.
-
Effects of aging on serum levels of lipid molecular species as determined by lipidomics analysis in Japanese men and women.Lipids Health Dis. 2018 Jun 6;17(1):135. doi: 10.1186/s12944-018-0785-6. Lipids Health Dis. 2018. PMID: 29875018 Free PMC article.
-
Comprehensive targeted and non-targeted lipidomics analyses in failing and non-failing heart.Anal Bioanal Chem. 2018 Mar;410(7):1965-1976. doi: 10.1007/s00216-018-0863-7. Epub 2018 Feb 6. Anal Bioanal Chem. 2018. PMID: 29411084 Free PMC article.
-
Splenic leukocytes define the resolution of inflammation in heart failure.Sci Signal. 2018 Mar 6;11(520):eaao1818. doi: 10.1126/scisignal.aao1818. Sci Signal. 2018. PMID: 29511119 Free PMC article.
-
Role of neutrophils in ischemic heart failure.Pharmacol Ther. 2020 Jan;205:107424. doi: 10.1016/j.pharmthera.2019.107424. Epub 2019 Oct 16. Pharmacol Ther. 2020. PMID: 31629005 Free PMC article. Review.
References
-
- Roger VL, Go AS, Lloyd-Jones DM, Benjamin EJ, Berry JD, Borden WB, Bravata DM, Dai S, Ford ES, Fox CS, Fullerton HJ, Gillespie C, Hailpern SM, et al. and American Heart Association Statistics Committee and Stroke Statistics Subcommittee. Heart disease and stroke statistics--2012 update: a report from the American Heart Association. Circulation. 2012;125:e2–220. doi: 10.1161/CIR.0b013e31823ac046. - DOI - PMC - PubMed
-
- Ismahil MA, Hamid T, Bansal SS, Patel B, Kingery JR, Prabhu SD. Remodeling of the mononuclear phagocyte network underlies chronic inflammation and disease progression in heart failure: critical importance of the cardiosplenic axis. Circ Res. 2014;114:266–82. doi: 10.1161/CIRCRESAHA.113.301720. - DOI - PMC - PubMed
-
- Lopez EF, Kabarowski JH, Ingle KA, Kain V, Barnes S, Crossman DK, Lindsey ML, Halade GV. Obesity superimposed on aging magnifies inflammation and delays the resolving response after myocardial infarction. Am J Physiol Heart Circ Physiol. 2015;308:H269–80. doi: 10.1152/ajpheart.00604.2014. - DOI - PMC - PubMed
Publication types
MeSH terms
Substances
Grants and funding
LinkOut - more resources
Full Text Sources
Other Literature Sources
Medical
Molecular Biology Databases
Research Materials
Miscellaneous
