Red blood cell thickness is evolutionarily constrained by slow, hemoglobin-restricted diffusion in cytoplasm
- PMID: 27777410
- PMCID: PMC5078773
- DOI: 10.1038/srep36018
Red blood cell thickness is evolutionarily constrained by slow, hemoglobin-restricted diffusion in cytoplasm
Abstract
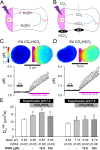
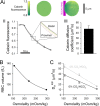
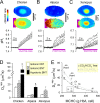
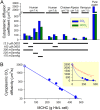
During capillary transit, red blood cells (RBCs) must exchange large quantities of CO2 and O2 in typically less than one second, but the degree to which this is rate-limited by diffusion through cytoplasm is not known. Gas diffusivity is intuitively assumed to be fast and this would imply that the intracellular path-length, defined by RBC shape, is not a factor that could meaningfully compromise physiology. Here, we evaluated CO2 diffusivity (DCO2) in RBCs and related our results to cell shape. DCO2 inside RBCs was determined by fluorescence imaging of [H+] dynamics in cells under superfusion. This method is based on the principle that H+ diffusion is facilitated by CO2/HCO3- buffer and thus provides a read-out of DCO2. By imaging the spread of H+ ions from a photochemically-activated source (6-nitroveratraldehyde), DCO2 in human RBCs was calculated to be only 5% of the rate in water. Measurements on RBCs containing different hemoglobin concentrations demonstrated a halving of DCO2 with every 75 g/L increase in mean corpuscular hemoglobin concentration (MCHC). Thus, to compensate for highly-restricted cytoplasmic diffusion, RBC thickness must be reduced as appropriate for its MCHC. This can explain the inverse relationship between MCHC and RBC thickness determined from >250 animal species.
Figures


Similar articles
-
Single-cell O2 exchange imaging shows that cytoplasmic diffusion is a dominant barrier to efficient gas transport in red blood cells.Proc Natl Acad Sci U S A. 2020 May 5;117(18):10067-10078. doi: 10.1073/pnas.1916641117. Epub 2020 Apr 22. Proc Natl Acad Sci U S A. 2020. PMID: 32321831 Free PMC article.
-
Red blood cell pH, the Bohr effect, and other oxygenation-linked phenomena in blood O2 and CO2 transport.Acta Physiol Scand. 2004 Nov;182(3):215-27. doi: 10.1111/j.1365-201X.2004.01361.x. Acta Physiol Scand. 2004. PMID: 15491402 Review.
-
Numerical solution of partial differential equations describing the simultaneous O2 and CO2 diffusions in the red blood cell.Jpn J Physiol. 1986;36(1):43-63. doi: 10.2170/jjphysiol.36.43. Jpn J Physiol. 1986. PMID: 3088308
-
Carbon dioxide transport in alligator blood and its erythrocyte permeability to anions and water.Am J Physiol. 1998 Mar;274(3):R661-71. doi: 10.1152/ajpregu.1998.274.3.R661. Am J Physiol. 1998. PMID: 9530231
-
Control and consequences of adrenergic activation of red blood cell Na+/H+ exchange on blood oxygen and carbon dioxide transport in fish.J Exp Zool. 1992 Aug 15;263(2):160-75. doi: 10.1002/jez.1402630206. J Exp Zool. 1992. PMID: 1323642 Review.
Cited by
-
Hematological Evaluation of Three Common Teleosts in Relation to The Environmental Changes from Trang Province, Thailand.Trop Life Sci Res. 2023 Sep;34(3):113-127. doi: 10.21315/tlsr2023.34.3.6. Epub 2023 Sep 30. Trop Life Sci Res. 2023. PMID: 37860093 Free PMC article.
-
Beyond just hemoglobin: Red blood cell potentiation of hemoglobin-oxygen unloading in fish.J Appl Physiol (1985). 2017 Oct 1;123(4):935-941. doi: 10.1152/japplphysiol.00114.2017. Epub 2017 Jul 13. J Appl Physiol (1985). 2017. PMID: 28705992 Free PMC article. Review.
-
Cell physiology and molecular mechanism of anion transport by erythrocyte band 3/AE1.Am J Physiol Cell Physiol. 2021 Dec 1;321(6):C1028-C1059. doi: 10.1152/ajpcell.00275.2021. Epub 2021 Oct 20. Am J Physiol Cell Physiol. 2021. PMID: 34669510 Free PMC article. Review.
-
CO₂ Permeability of Biological Membranes and Role of CO₂ Channels.Membranes (Basel). 2017 Oct 24;7(4):61. doi: 10.3390/membranes7040061. Membranes (Basel). 2017. PMID: 29064458 Free PMC article. Review.
-
Single-cell O2 exchange imaging shows that cytoplasmic diffusion is a dominant barrier to efficient gas transport in red blood cells.Proc Natl Acad Sci U S A. 2020 May 5;117(18):10067-10078. doi: 10.1073/pnas.1916641117. Epub 2020 Apr 22. Proc Natl Acad Sci U S A. 2020. PMID: 32321831 Free PMC article.
References
-
- Wagner P. D. Diffusion and chemical reaction in pulmonary gas exchange. Physiol Rev 57, 257–312 (1977). - PubMed
-
- Geers C. & Gros G. Carbon dioxide transport and carbonic anhydrase in blood and muscle. Physiol Rev 80, 681–715 (2000). - PubMed
-
- Uzoigwe C. The human erythrocyte has developed the biconcave disc shape to optimise the flow properties of the blood in the large vessels. Med Hypotheses 67, 1159–1163 (2006). - PubMed
Publication types
MeSH terms
Substances
LinkOut - more resources
Full Text Sources
Other Literature Sources

