. 2016 Oct 10:10:465.
doi: 10.3389/fnhum.2016.00465. eCollection 2016.

Snap Your Fingers! An ERP/sLORETA Study Investigating Implicit Processing of Self- vs. Other-Related Movement Sounds Using the Passive Oddball Paradigm

Affiliations

Snap Your Fingers! An ERP/sLORETA Study Investigating Implicit Processing of Self- vs. Other-Related Movement Sounds Using the Passive Oddball Paradigm

Christoph Justen et al. Front Hum Neurosci. .

Abstract

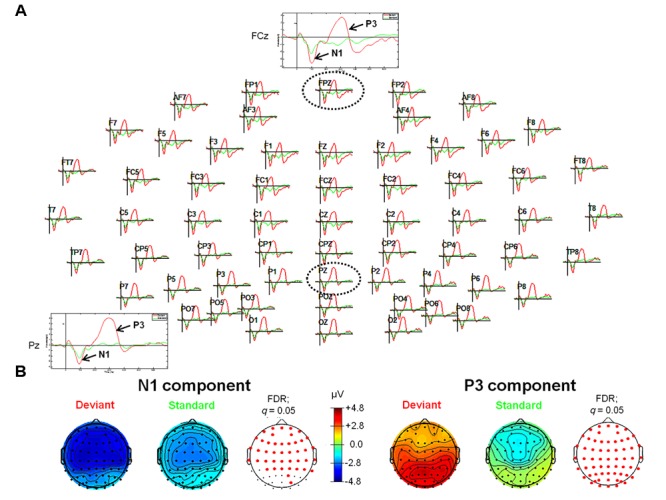
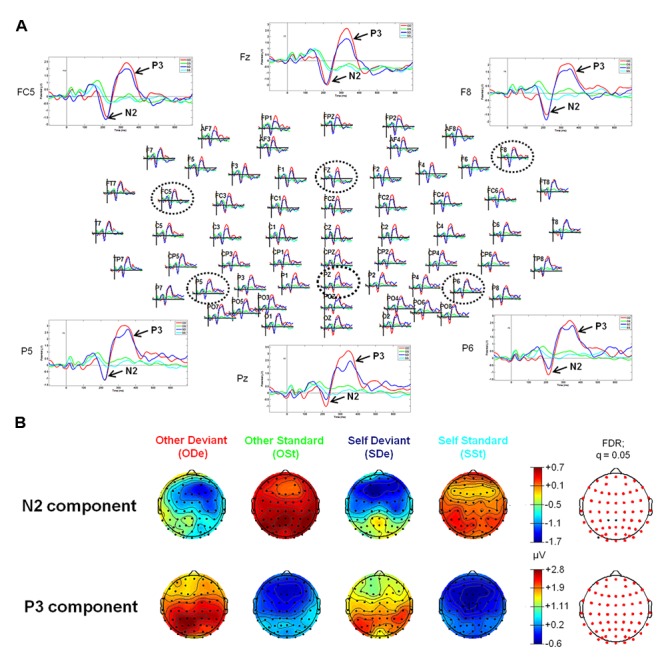
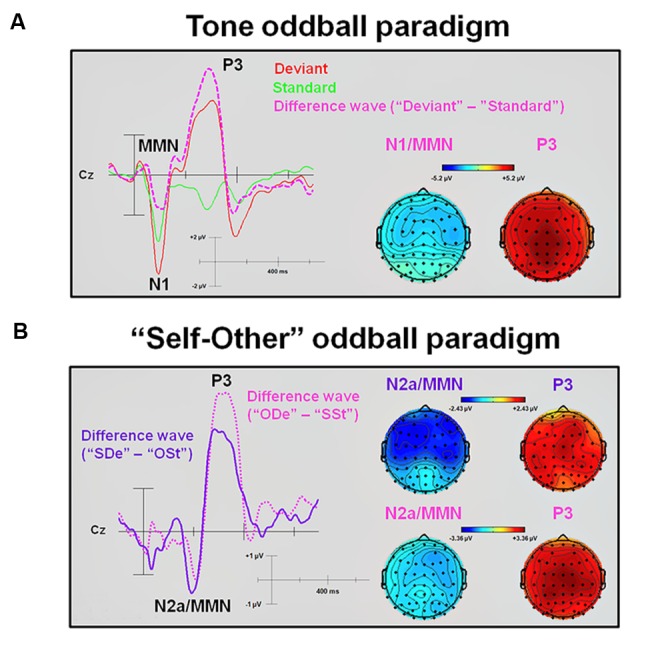
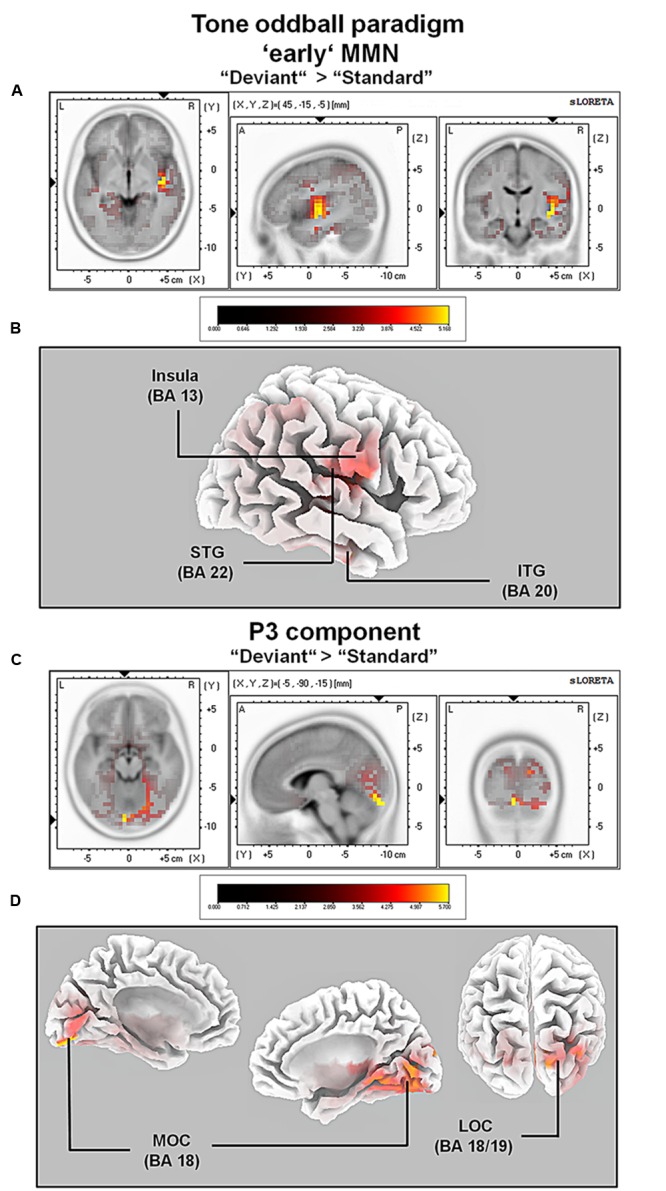
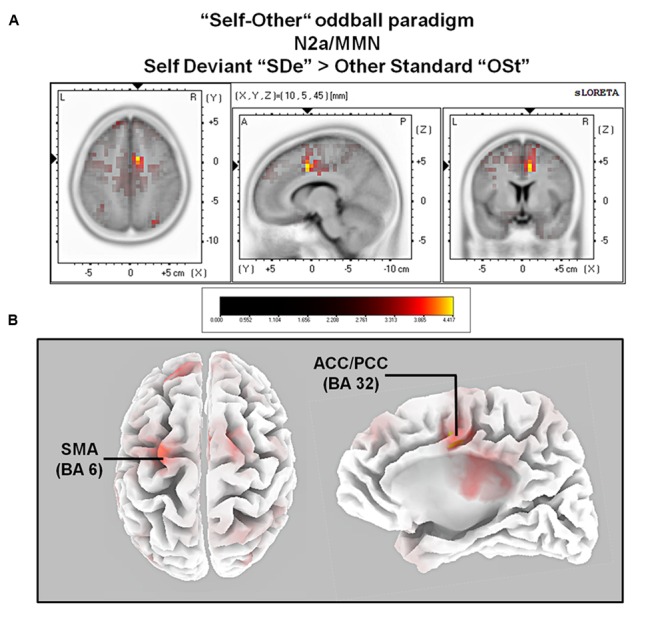
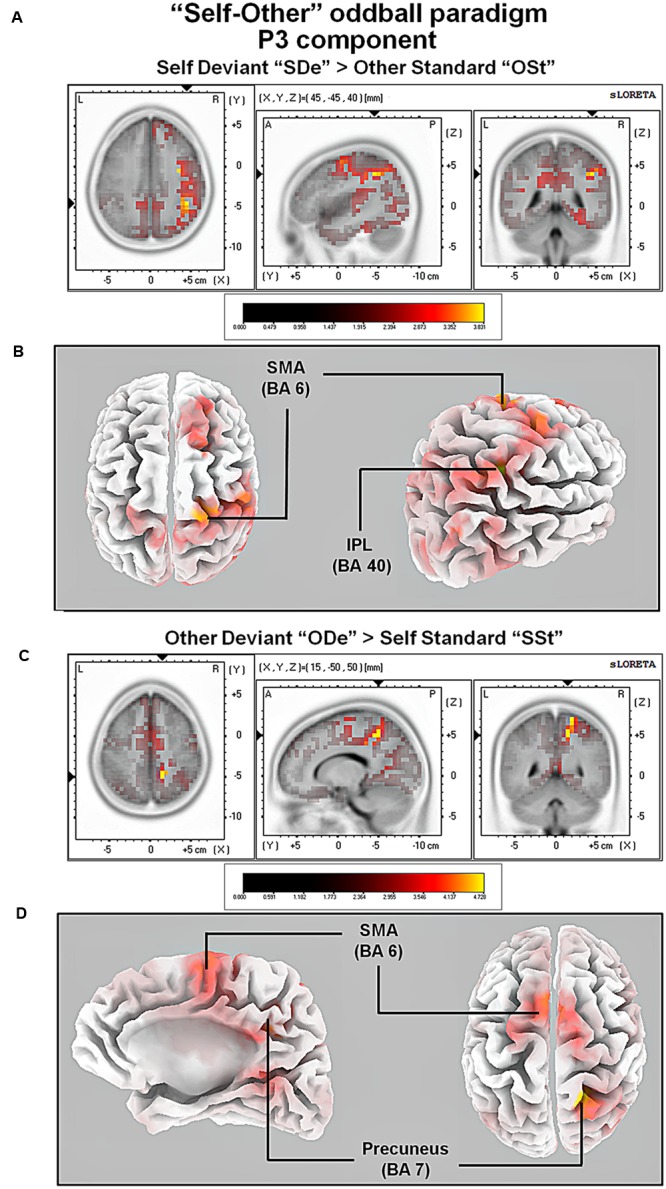
So far, neurophysiological studies have investigated implicit and explicit self-related processing particularly for self-related stimuli such as the own face or name. The present study extends previous research to the implicit processing of self-related movement sounds and explores their spatio-temporal dynamics. Event-related potentials (ERPs) were assessed while participants (N = 12 healthy subjects) listened passively to previously recorded self- and other-related finger snapping sounds, presented either as deviants or standards during an oddball paradigm. Passive listening to low (500 Hz) and high (1000 Hz) pure tones served as additional control. For self- vs. other-related finger snapping sounds, analysis of ERPs revealed significant differences in the time windows of the N2a/MMN and P3. An subsequent source localization analysis with standardized low-resolution brain electromagnetic tomography (sLORETA) revealed increased cortical activation in distinct motor areas such as the supplementary motor area (SMA) in the N2a/mismatch negativity (MMN) as well as the P3 time window during processing of self- and other-related finger snapping sounds. In contrast, brain regions associated with self-related processing [e.g., right anterior/posterior cingulate cortex (ACC/PPC)] as well as the right inferior parietal lobule (IPL) showed increased activation particularly during processing of self- vs. other-related finger snapping sounds in the time windows of the N2a/MMN (ACC/PCC) or the P3 (IPL). None of these brain regions showed enhanced activation while listening passively to low (500 Hz) and high (1000 Hz) pure tones. Taken together, the current results indicate (1) a specific role of motor regions such as SMA during auditory processing of movement-related information, regardless of whether this information is self- or other-related, (2) activation of neural sources such as the ACC/PCC and the IPL during implicit processing of self-related movement stimuli, and (3) their differential temporal activation during deviance (N2a/MMN - ACC/PCC) and target detection (P3 - IPL) of self- vs. other-related movement sounds.

Keywords: EEG; N2a/MMN; P3; finger snapping sounds; source localization.


Figures

FIGURE 1
FIGURE 1
Event-related potentials (ERPs; upper panel, A) and topographic plots (lower panel, B) for the N1 (lower panel, left) and P3 (lower panel, right) components in the experimental conditions of the tone oddball paradigm. (A) The head plot shows ERP waveforms from 62 electrode sites. One anterior electrode site (FCz) as well as one posterior electrode site (Pz) are shown in detail (as indicated by the black dashed circles). ERP waveform plots reveal the N1 and the P3 components with significantly higher amplitudes in response to deviant stimuli (pure tones with a frequency of 1000 Hz) as compared to standard stimuli (pure tones with a frequency of 500 Hz). (B) Reddish colors indicate positive ERP values, whereas bluish colors indicate negative ERP values. In addition, transparent EEG montage arrays (lower panel B) show statistically significant electrode sites as indicated by red dots (after comparison for multiple comparisons with FDR). Obtained time windows have been averaged between 82–129 ms (N1 component) and 233–358 ms (P3 component), respectively. FDR, False discovery rate.
FIGURE 2
FIGURE 2
Event-related potentials (upper panel, A) and topographic plots (lower panel, B) for the N2 and P3 components in all four experimental conditions of the “Self-Other” oddball paradigm. (A) The head plot shows ERP waveforms from 62 electrode sites. Three anterior electrode sites (FC5, Fz, and F8) as well as three posterior electrodes (P5, Pz, and P6) are shown in detail (as indicated by black dashed circles). ERP waveform plots reveal the N2-P3 complex. Higher amplitudes of the N2 component can be observed at anterior sides, whereas the P3 shows higher amplitudes at posterior electrode sites (especially in condition “ODe”). (B) Reddish colors indicate positive ERP values, whereas bluish colors indicate negative ERP values. Moreover, transparent EEG montage arrays (lower panel B) show statistically significant electrode sites as indicated by red dots (after comparison for multiple comparisons with FDR). FDR, False discovery rate.
FIGURE 3
FIGURE 3
Difference waveforms and corresponding topographic plots obtained from subtracting standards from deviants in the tone and the “Self-Other” oddball paradigm. (A) An averaged ERP waveform and an extracted difference wave (“Deviant” minus “Standard”) at electrode site Cz. In addition, topographic plots of the N1/MMN and P3 peaks are shown. (B) Extracted difference waves (“SDe” minus “OSt” and “ODe” minus “SSt,” respectively) at electrode site Cz. In addition, topographic plots of the N2a/MMN and P3 peaks are shown. MMN, Mismatch negativity.
FIGURE 4
FIGURE 4
Results of the standardized low-resolution brain electrotomography (sLORETA) source localization analysis (contrast: “Deviant” > Standard”) in the averaged time window of the ‘early’ MMN and P3 components (84–129 and 242–344 ms, respectively). Images have been obtained after statistical non-parametric mapping (SnPM) and co-registration to the stereotaxic Talairach space based on the Co-Planar Stereotaxic Atlas of the Human Brain (Talairach and Tournoux, 1988) and the probabilistic MNI-152 template (Mazziotta et al., 2001). Activated voxels are indicated by yellowish and reddish colors [after correction for multiple comparisons (p < 0.01 and p < 0.05, respectively)]. (A) The peak of highest cortical activity has been found in parts of the superior temporal gyrus (STG; BA 22). (B) A shifted lateral view of the right hemisphere, showing cortical activations on the three-dimensionally rendered Colin27 template (Holmes et al., 1998). (C) The peak of highest cortical activity was found in the left medial occipital cortex (MOC; BA 19). (D) Two medial views on the left as well as the right hemisphere with cortical activations in the medial occipital cortices bilaterally and additionally in the right lateral occipital cortex (LOC; BAs 18 and 19), rendered on the Colin27 template (Holmes et al., 1998). L, left; R, right; A, anterior; P, posterior; MNI, Montreal Neurological Institute; X, Y, Z, corresponding MNI coordinates; BA, Brodmann area; MOC, medial occipital cortex; LOC, lateral occipital cortex; PCC, posterior cingulate cortex; ITG, inferior temporal gyrus.
FIGURE 5
FIGURE 5
Results of the sLORETA source localization analysis (contrast: “SDe” > “OSt”) in the averaged time window of the N2a/MMN component (180–219 ms). Images have been obtained after SnPM and co-registration to the stereotaxic Talairach space based on the Co-Planar Stereotaxic Atlas of the Human Brain (Talairach and Tournoux, 1988) and the probabilistic MNI-152 template (Mazziotta et al., 2001). Activated voxels are indicated by yellowish and reddish colors [after correction for multiple comparisons (p < 0.01 and p < 0.05, respectively)]. (A) The peak of highest cortical activity was found in parts of the right ACC/PCC (BA 32) on the right medial surface of the brain. (B) A top view on the brain (left panel) shows highest cortical activity in the left supplementary motor area (SMA; BA 6). A lateral view on the right medial surface of the brain (right panel) shows cortical activations in the right ACC/PPC (BA 32), rendered on the Colin27 template (Holmes et al., 1998). L, left; R, right; A, anterior; P, posterior; MNI, Montreal Neurological Institute; X, Y, Z, corresponding MNI coordinates; BA, Brodmann area; SMA, supplementary motor area; ACC, anterior cingulate cortex; PCC, posterior cingulate cortex.
FIGURE 6
FIGURE 6
Results of the sLORETA source localization analysis (contrasts: “SDe” > “OSt” and “ODe” > “SSt,” respectively) in the averaged time window of the P3 components (295–367 and 275–387 ms, respectively). Images have been obtained after SnPM and co-registration to the stereotaxic Talairach space based on the Co-Planar Stereotaxic Atlas of the Human Brain (Talairach and Tournoux, 1988) and the probabilistic MNI-152 template (Mazziotta et al., 2001). Activated voxels are indicated by yellowish and reddish colors [after correction for multiple comparisons (p < 0.01 and p < 0.05, respectively)]. (A) The peak of highest cortical activity was found in the right inferior parietal lobule (IPL; BA 40). (B) A lateral view on the right hemisphere (right panel) and a top view on the whole brain (left panel) show highest cortical activations in the right IPL (BA 40) and the left supplementary area (SMA; BA 6) rendered on the Colin27 template (Holmes et al., 1998). (C) The peak of highest cortical activity was found in parts of the right precuneus (BA 7). (D) A top view on the whole brain (right panel) and additionally a medial view on right hemisphere (left panel) show cortical activations in the right precuneus (BA 7) and bilaterally in the supplementary motor area (SMA; BA 6) on the rendered Colin27 template (Holmes et al., 1998). L, left; R, right; A, anterior; P, posterior; MNI, Montreal Neurological Institute; X, Y, Z, corresponding MNI coordinates; BA, Brodmann area; TPJ, temporoparietal junction.

Similar articles

Cited by

References

    1. Alcaini M., Giard M. H., Thévenet M., Pernier J. (1994). Two separate frontal components in the N1 wave of the human auditory evoked response. Psychophysiology 31 611–615. 10.1111/j.1469-8986.1994.tb02354.x - DOI - PubMed
    1. Antinoro F., Skinner P. H., Jones J. J. (1969). Relation between sound intensity and amplitude of the AER at different stimulus frequencies. J. Acoust. Soc. Am. 46 1433–1436. 10.1121/1.1911881 - DOI - PubMed
    1. Aziz-Zadeh L., Iacoboni M., Zaidel E., Wilson S., Mazziotta J. (2004). Left hemisphere motor facilitation in response to manual action sounds. Eur. J. Neurosci. 19 2609–2612. 10.1111/j.0953-816X.2004.03348.x - DOI - PubMed
    1. Bamiou D.-E., Musiek F. E., Luxon L. M. (2003). The insula (Island of Reil) and its role in auditory processing. Brain Res. Rev. 42 143–154. 10.1016/S0165-0173(03)00172-3 - DOI - PubMed
    1. Bénar C.-G., Schön D., Grimault S., Nazarian B., Burle B., Roth M., et al. (2007). Single-trial analysis of oddball event-related potentials in simultaneous EEG-fMRI. Hum. Brain Mapp. 28 602–613. 10.1002/hbm.20289 - DOI - PubMed

LinkOut - more resources