. 2016 Oct 10:7:413.
doi: 10.3389/fimmu.2016.00413. eCollection 2016.

Phenotypic and Functional Dysregulated Blood NK Cells in Colorectal Cancer Patients Can Be Activated by Cetuximab Plus IL-2 or IL-15

Affiliations

Phenotypic and Functional Dysregulated Blood NK Cells in Colorectal Cancer Patients Can Be Activated by Cetuximab Plus IL-2 or IL-15

Yamila Sol Rocca et al. Front Immunol. .

Abstract

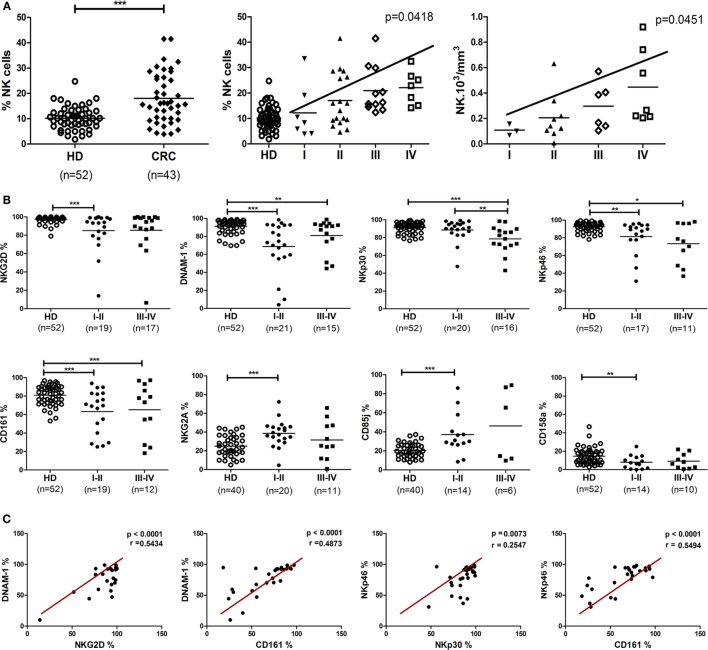
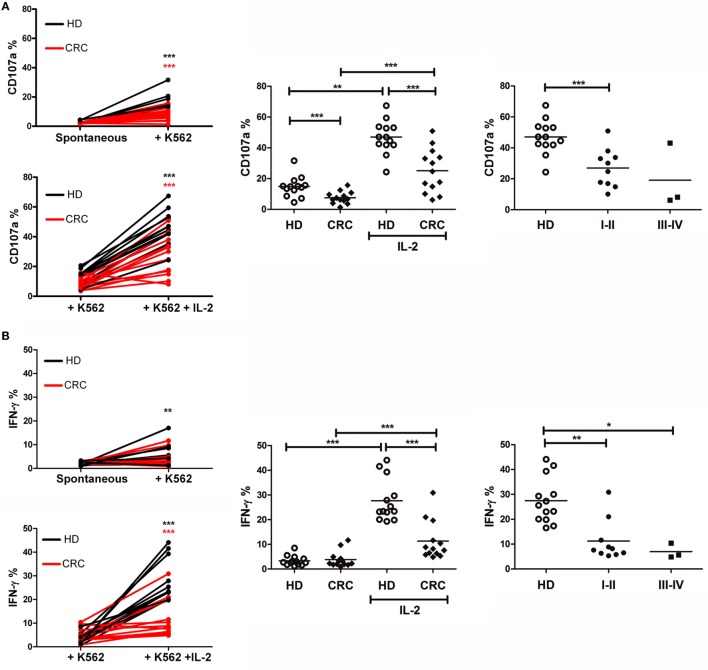
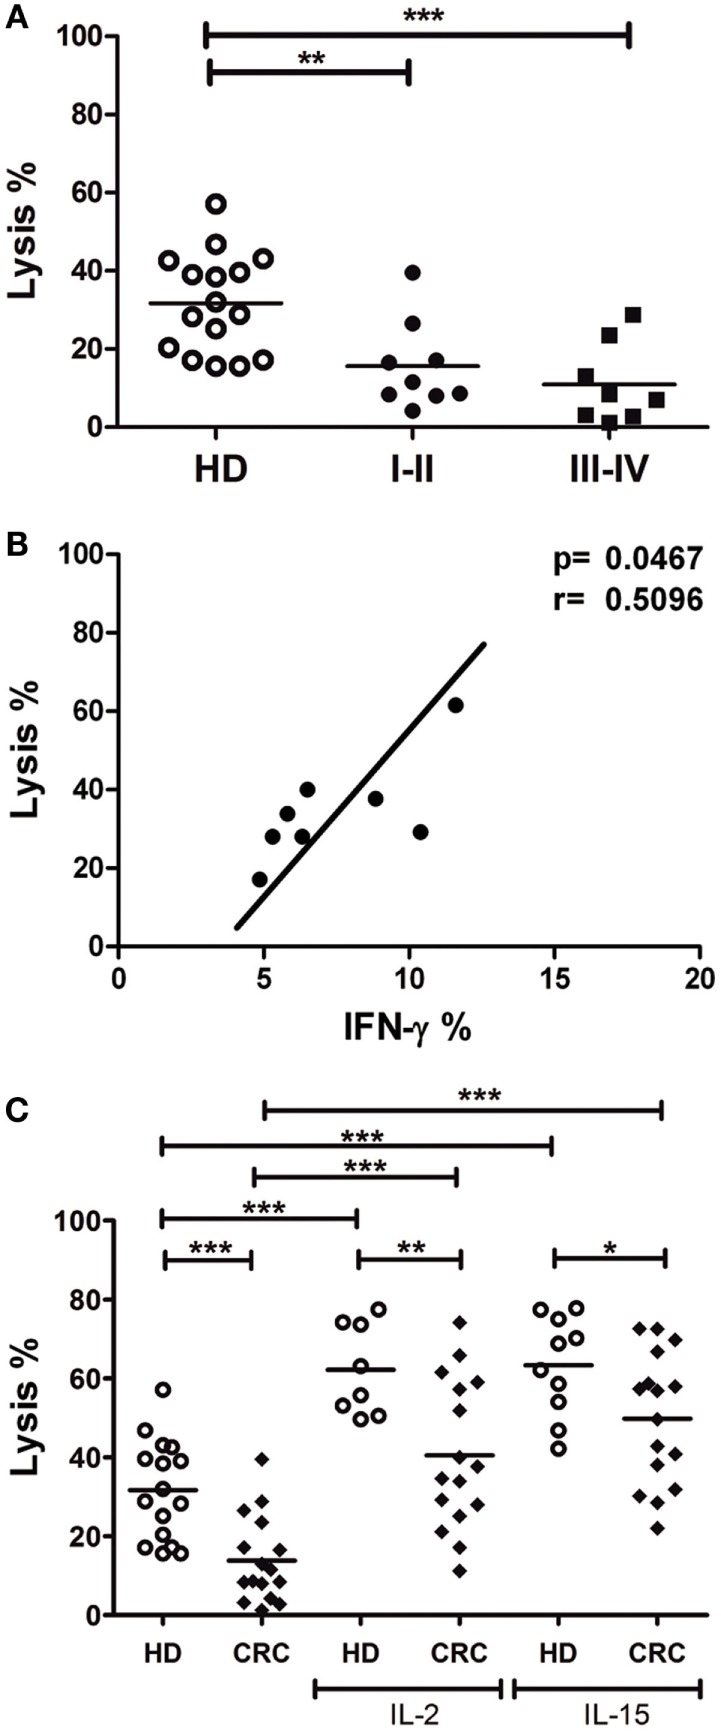
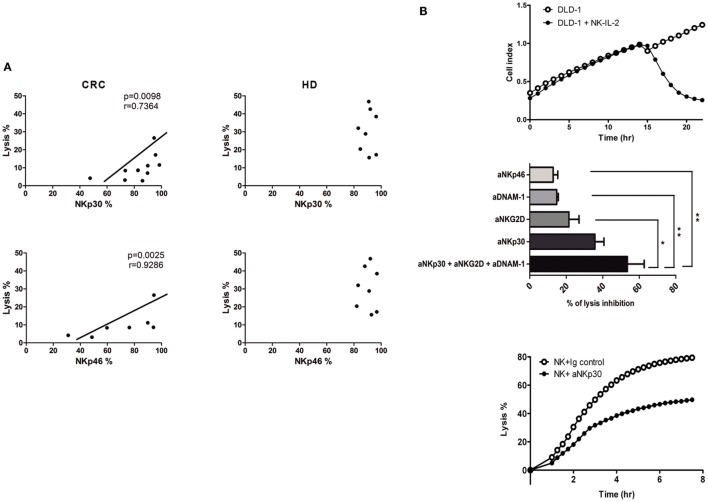
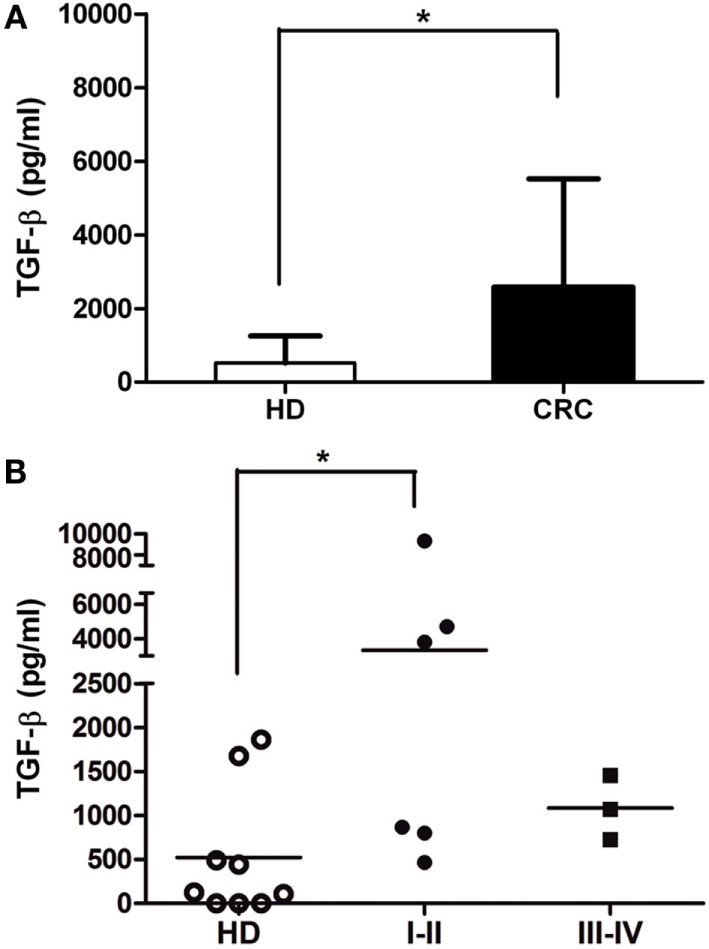
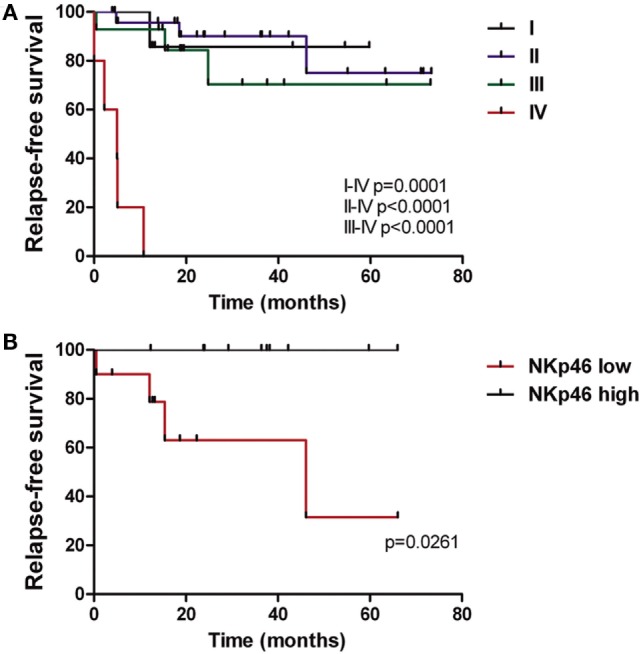
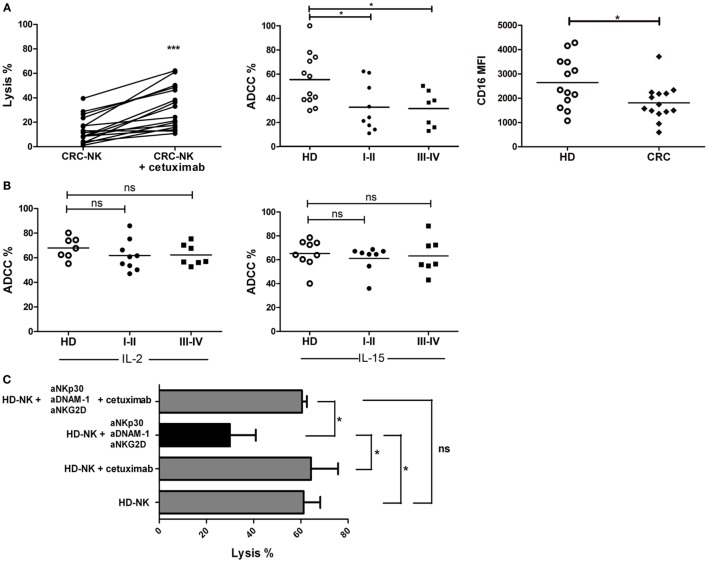
The clinical outcome of colorectal cancer (CRC) is associated with the immune response; thus, these tumors could be responsive to different immune therapy approaches. Natural killer (NK) cells are key antitumor primary effectors that can eliminate CRC cells without prior immunization. We previously determined that NK cells from the local tumor environment of CRC tumors display a profoundly altered phenotype compared with circulating NK cells from healthy donors (HD). In this study, we evaluated peripheral blood NK cells from untreated patients and their possible role in metastasis progression. We observed profound deregulation in receptor expression even in early stages of disease compared with HD. CRC-NK cells displayed underexpression of CD16, NKG2D, DNAM-1, CD161, NKp46, and NKp30 activating receptors, while inhibitory receptors CD85j and NKG2A were overexpressed. This inhibited phenotype affected cytotoxic functionality against CRC cells and interferon-γ production. We also determined that NKp30 and NKp46 are the key receptors involved in detriment of CRC-NK cells' antitumor activity. Moreover, NKp46 expression correlated with relapse-free survival of CRC patients with a maximum follow-up of 71 months. CRC-NK cells also exhibited altered antibody-dependent cellular cytotoxicity function responding poorly to cetuximab. IL-2 and IL-15 in combination with cetuximab stimulated NK cell, improving cytotoxicity. These results show potential strategies to enhance CRC-NK cell activity.

Keywords: IL-15; IL-2; NKp30; NKp46; cetuximab; colorectal cancer; natural killer cells.


Figures

Figure 1
Figure 1
Proportions, absolute numbers, and phenotype of peripheral blood NK cells from CRC patients. (A) Left: NK proportions in lymphocytes population of CRC patients (n = 43) and healthy donors (n = 52). Each symbol corresponds to different samples. For statistical analysis unpaired t-test was used. Middle: CRC-NK proportions in patients at different stages of the disease. Linear trend by one-way ANOVA test (p < 0.05). Right: distribution of CRC-NK absolute numbers expressed as 103/mm3 (n = 25). Linear trend by one-way ANOVA test (p < 0.05). (B) Expression of NK cell receptors. Activating and inhibitory receptor expression by peripheral blood NK cells from CRC patients of early (I–II) and late (III–IV) stages compared with healthy donors. For statistical analysis unpaired t-test or Mann–Whitney test were used. Horizontal bar represents mean value. *p < 0.05; **p < 0.01; ***p < 0.001. (C) Positive correlations between activating receptor expression in peripheral blood NK cells from CRC patients. Correlations between different receptor expressions were performed with Spearman or Pearson test. Regression coefficients r and p values on each graph.
Figure 2
Figure 2
Peripheral blood CRC-NK cells exhibit defective functionality. (A) NK cell degranulation capacity. Left: degranulation by HD (black) and CRC patient (red) NK cells stimulated by K562 with (lower) or without IL-2 pre-activation (upper). Comparisons were analyzed by paired t-test. Middle: %CD107a+ NK cells from HD and CRC patients pre-stimulated or not with IL-2 (n = 13). Right: degranulation by IL-2 pre-stimulated NK cells from HD or CRC patients according to early (I–II) and late (III–IV) stages. Comparison of NK cell function between donors and patients were analyzed by non-parametric Mann–Whitney test. (B) IFN-γ production by NK cells. Left: IFN-γ secretion by HD-NK (black) and CRC-NK cells (red) NK cells stimulated by K562 with (lower) or without IL-2 pre-activation (upper). Comparisons were analyzed by paired t-test. Middle: percentages of IFN-γ+ NK cells from HD and CRC patients, pre-stimulated or not with IL-2 (n = 13). Right: IL-2-pre-stimulated NK cells from HD and CRC patients according to early (I–II) and late (III–IV) stages. Comparison of NK cell function between donors and patients were analyzed by non-parametric Mann–Whitney test. Horizontal bar represents mean value. *p < 0.05; **p < 0.01; ***p < 0.001.
Figure 3
Figure 3
Lytic activity against CRC cells is reduced in CRC-NK cells. (A) Lysis percentage by CRC-NK (n = 17) and HD-NK (n = 16) cells measured by calcein release test. DLD-1 tumor cells were used as target at an E:T ratio of 2.5:1. Patients were divided in early (I–II) or late (III–IV) stages. (B) Positive correlation between functional activities of NK cells from CRC patients, lysis capacity, and IFN-γ production. (C) Lysis percentage of DLD-1 cells by CRC-NK and HD-NK pre-stimulated by IL-2 or IL-15. Horizontal bar represents mean value. *p < 0.05; **p < 0.01; ***p < 0.001.
Figure 4
Figure 4
NK cell receptors involved in lytic activity. (A) Correlations between NK cell receptor expression and lysis activity against DLD-1 cells from CRC-NK (left) and HD-NK (right). Correlations were performed with Spearman or Pearson test. Regression coefficients r and p values on each graph. (B) Upper: representative graph of dynamic measurement of DLD-1 cell index vs. time in control conditions (white dots) or with IL-2-activated NK cells from HD (black dots). Middle: percentage of DLD-1 cells lysis inhibition using different blocking antibodies against NK cell-activating receptors measured at 300 min (n = 3 independent experiments). Percentage of lysis inhibition was calculated as: (% lysis with isotypic control mAb − % lysis with blocking mAb)/% lysis with isotypic control mAb × 100. Comparison was performed using one-way ANOVA. Lower: percentage of DLD-1 lysis by IL-2-activated HD-NK cells with isotype mAb control or NKp30 blocking mAb. E:T 1:1 NK: DLD-1. *p < 0.05. **p < 0.01.
Figure 5
Figure 5
Soluble TGF-β is augmented in CRC plasma. (A) TGF-β concentration (picograms per milliliter) in plasma of CRC patients and HD, measured by ELISA (n = 9). (B) TGF-β levels of CRC patients according to disease stage (I–II and III–IV). Horizontal bar represents mean value.* p < 0.05.
Figure 6
Figure 6
NKp46 expression is correlated with relapse-free survival of CRC patients. (A) Kaplan–Meier curves of CRC patients (n = 52) performed as relapse-free survival percentage through time according to disease stage (I–IV). (B) Relapse-free survival curves of CRC patients (n = 10 in each group) according to NKp46 receptor expression by NK cells. Median value of NKp46 percentage in CRC population (86.9%) was used as cut-off between the two groups.
Figure 7
Figure 7
CRC-NK lysis is restored by cetuximab. (A) Left: percentage of DLD-1 lysis by CRC-NK cells at 2.5:1 E:T ratio assessed by calcein release test in presence of an isotype control mAb or Cetuximab (1 μg/ml). Middle: ADCC percentages of CRC patients (n = 16) divided in early (I–II) and late (III–IV) stages. Right: CD16 mean fluorescence intensity (MFI) measured in CRC-NK (n = 14) and HD-NK cells. (B) Percentages of DLD-1 cells lysis at 2.5:1 ratio in presence of cetuximab (1 μg/ml) by IL-2- (left) or IL-15- (right) pre-stimulated CRC-NK and HD-NK cells. Patients were divided in early (I–II) and late (III–IV) stages. (C) Percentages of DLD-1 lysis by IL-2-pre-stimulated purified HD-NK cells in presence of isotype antibodies; cetuximab; NKp30, DNAM-1, and NKG2D blocking antibodies; or these blocking antibodies plus cetuximab (n = 3 independent experiments). *p < 0.05; ns, non-significant.

References

    1. Siegel R, Naishadham D, Jemal A. Cancer statistics, 2013. CA Cancer J Clin (2013) 63:11–30.10.3322/caac.21166 - DOI - PubMed
    1. O’Connell JB, Maggard MA, Ko CY. Colon cancer survival rates with the new American Joint Committee on Cancer sixth edition staging. J Natl Cancer Inst (2004) 96:1420–5.10.1093/jnci/djh275 - DOI - PubMed
    1. Hurwitz H, Fehrenbacher L, Novotny W, Cartwright T, Hainsworth J, Heim W, et al. Bevacizumab plus irinotecan, fluorouracil, and leucovorin for metastatic colorectal cancer. N Engl J Med (2004) 350:2335–42.10.1056/NEJMoa032691 - DOI - PubMed
    1. Sandler A, Gray R, Perry MC, Brahmer J, Schiller JH, Dowlati A, et al. Paclitaxel-carboplatin alone or with bevacizumab for non-small-cell lung cancer. N Engl J Med (2006) 355(24):2542–50. - PubMed
    1. Chu E. An update on the current and emerging targeted agents in metastatic colorectal cancer. Clin Colorectal Cancer (2012) 11:1–13.10.1016/j.clcc.2011.05.005 - DOI - PubMed