

A Transcriptomic Signature of Mouse Liver Progenitor Cells
- PMID: 27777588
- PMCID: PMC5061959
- DOI: 10.1155/2016/5702873
A Transcriptomic Signature of Mouse Liver Progenitor Cells
Abstract
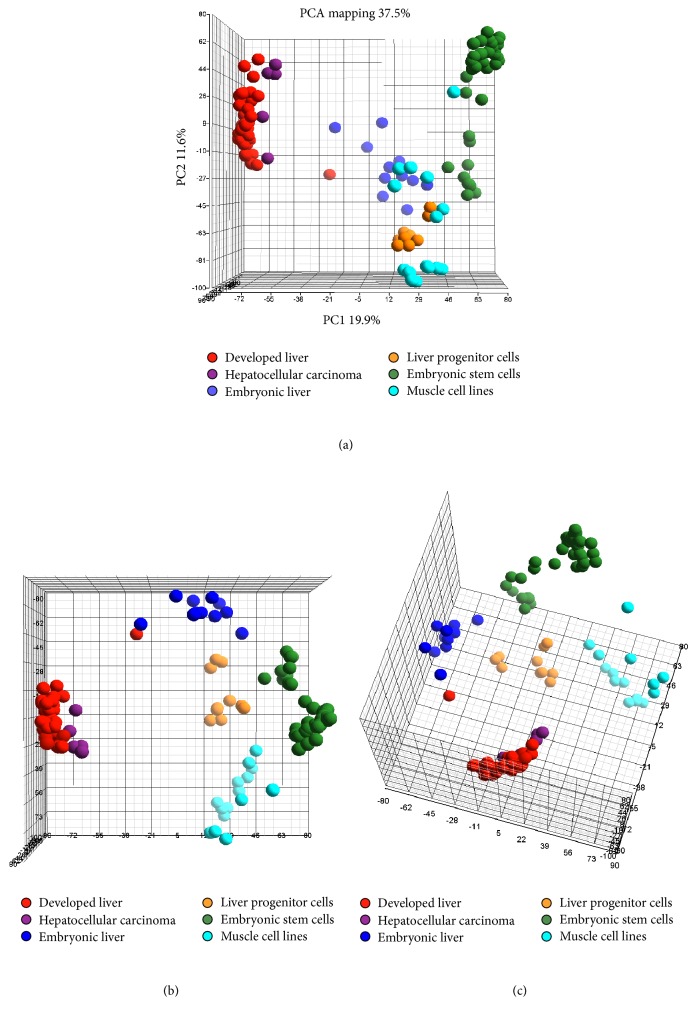
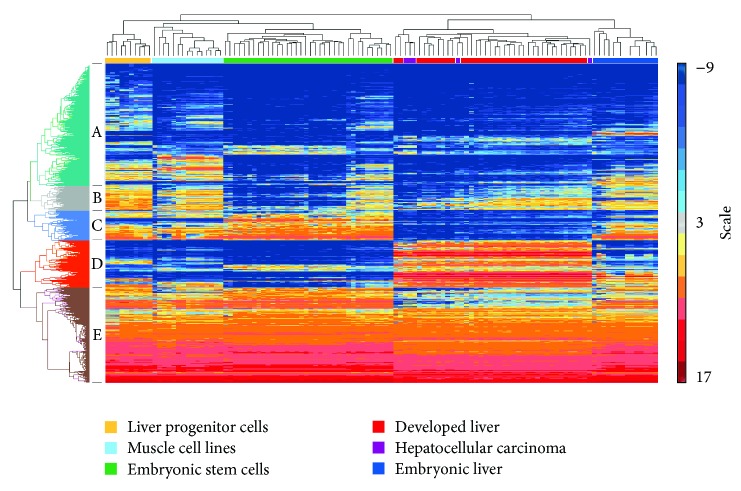
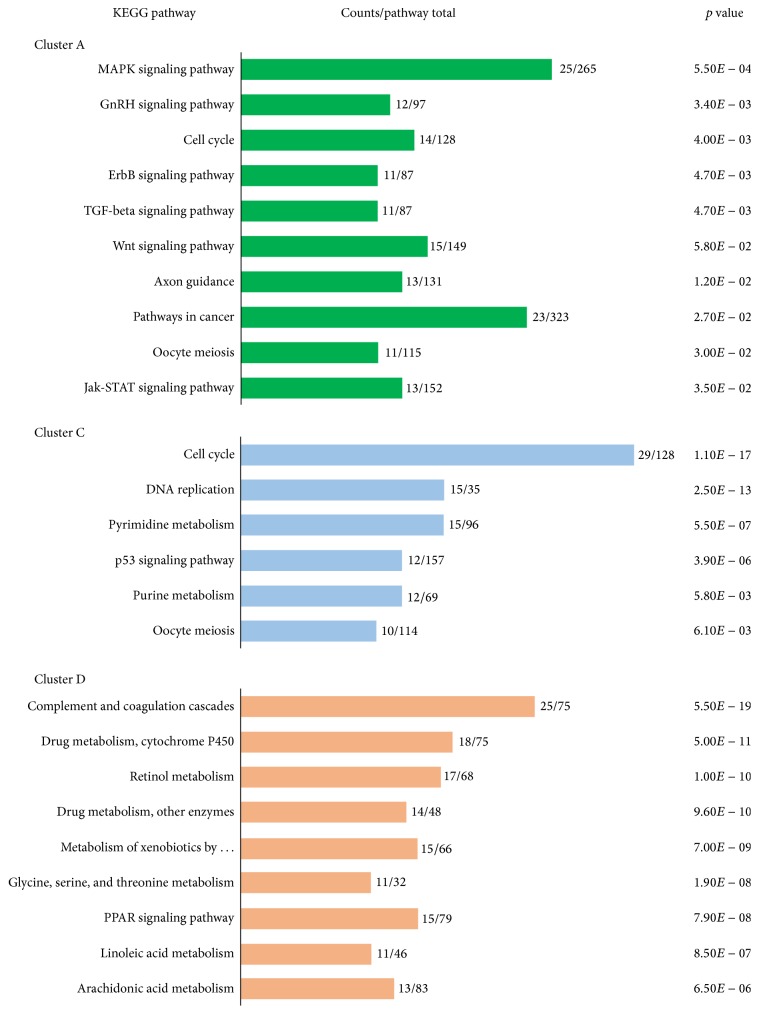
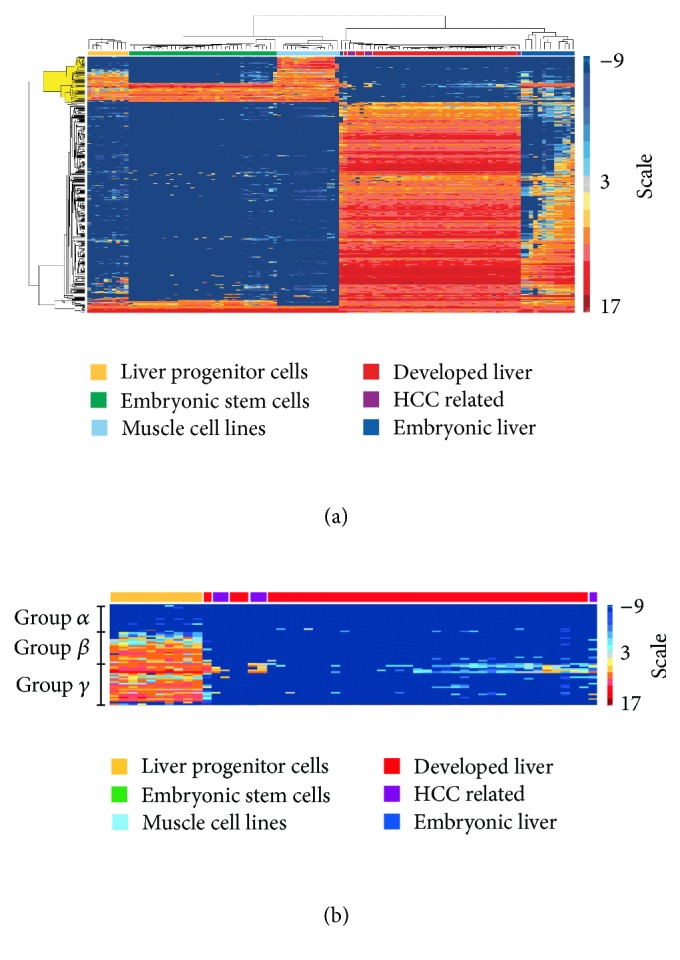
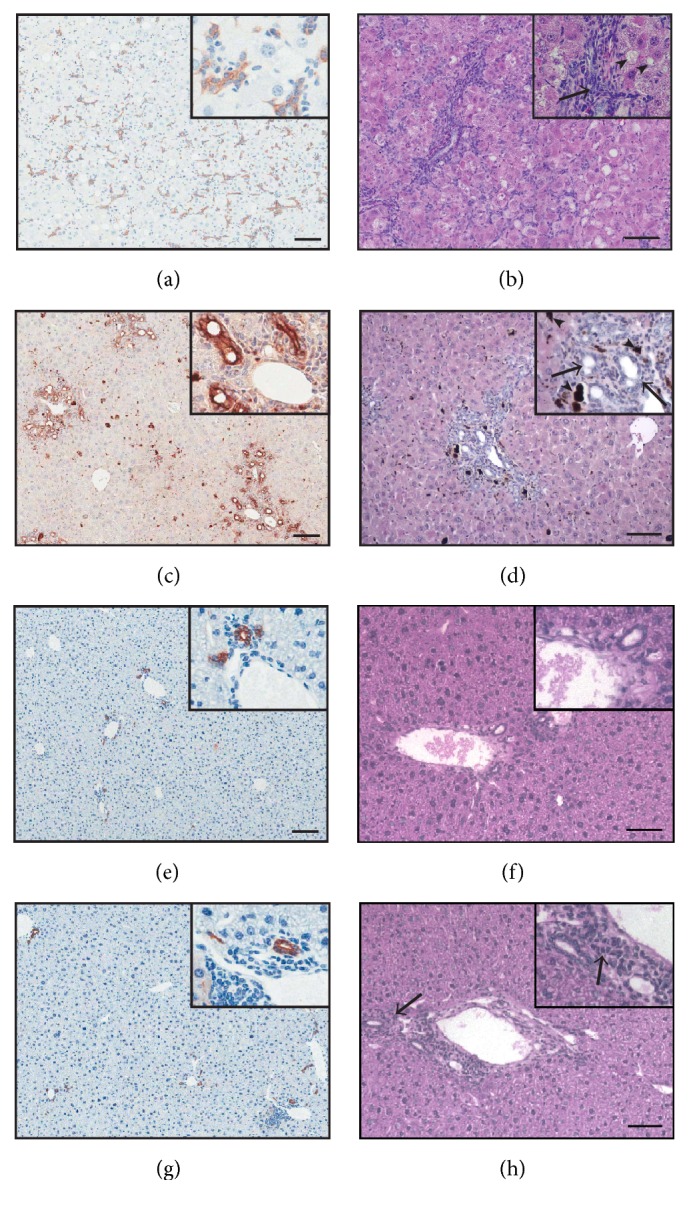
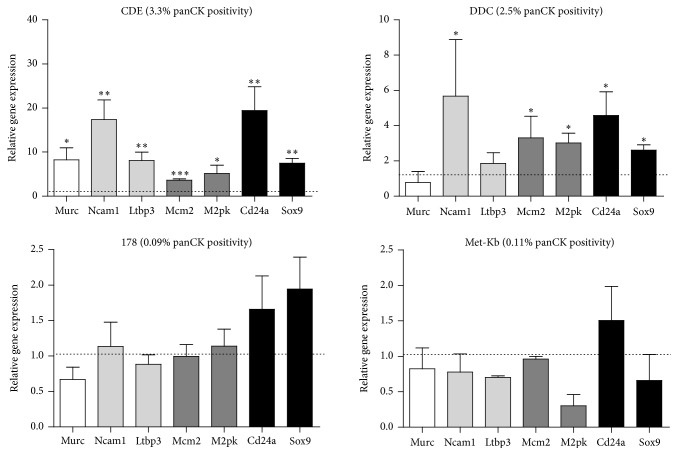
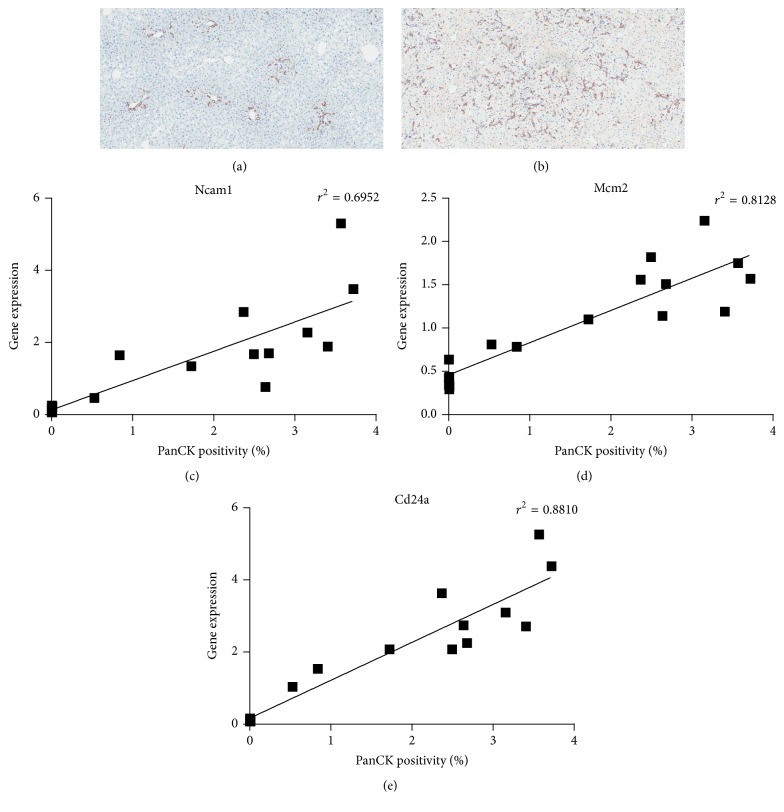
Liver progenitor cells (LPCs) can proliferate extensively, are able to differentiate into hepatocytes and cholangiocytes, and contribute to liver regeneration. The presence of LPCs, however, often accompanies liver disease and hepatocellular carcinoma (HCC), indicating that they may be a cancer stem cell. Understanding LPC biology and establishing a sensitive, rapid, and reliable method to detect their presence in the liver will assist diagnosis and facilitate monitoring of treatment outcomes in patients with liver pathologies. A transcriptomic meta-analysis of over 400 microarrays was undertaken to compare LPC lines against datasets of muscle and embryonic stem cell lines, embryonic and developed liver (DL), and HCC. Three gene clusters distinguishing LPCs from other liver cell types were identified. Pathways overrepresented in these clusters denote the proliferative nature of LPCs and their association with HCC. Our analysis also revealed 26 novel markers, LPC markers, including Mcm2 and Ltbp3, and eight known LPC markers, including M2pk and Ncam. These markers specified the presence of LPCs in pathological liver tissue by qPCR and correlated with LPC abundance determined using immunohistochemistry. These results showcase the value of global transcript profiling to identify pathways and markers that may be used to detect LPCs in injured or diseased liver.
Figures
Similar articles
-
Integrative single-cell and spatial transcriptome analysis reveals heterogeneity of human liver progenitor cells.Hepatol Commun. 2025 Feb 26;9(3):e0662. doi: 10.1097/HC9.0000000000000662. eCollection 2025 Mar 1. Hepatol Commun. 2025. PMID: 40008906 Free PMC article.
-
Identification of a Liver Progenitor Cell-Related Genes Signature Predicting Overall Survival for Hepatocellular Carcinoma.Technol Cancer Res Treat. 2021 Jan-Dec;20:15330338211041425. doi: 10.1177/15330338211041425. Technol Cancer Res Treat. 2021. PMID: 34866477 Free PMC article.
-
Loss of ARF/INK4A Promotes Liver Progenitor Cell Transformation Toward Tumorigenicity Supporting Their Role in Hepatocarcinogenesis.Gene Expr. 2020 Jun 12;20(1):39-52. doi: 10.3727/105221620X15874935364268. Epub 2020 Apr 21. Gene Expr. 2020. PMID: 32317048 Free PMC article.
-
Re-evaluation of liver stem/progenitor cells.Organogenesis. 2014 Apr-Jun;10(2):208-15. doi: 10.4161/org.27591. Epub 2014 Jan 22. Organogenesis. 2014. PMID: 24451175 Free PMC article. Review.
-
To be or not to be: The double-edged sword roles of liver progenitor cells.Biochim Biophys Acta Rev Cancer. 2023 May;1878(3):188870. doi: 10.1016/j.bbcan.2023.188870. Epub 2023 Feb 24. Biochim Biophys Acta Rev Cancer. 2023. PMID: 36842766 Review.
Cited by
-
The transcription factor Klf5 is essential for intrahepatic biliary epithelial tissue remodeling after cholestatic liver injury.J Biol Chem. 2018 Apr 27;293(17):6214-6229. doi: 10.1074/jbc.RA118.002372. Epub 2018 Mar 9. J Biol Chem. 2018. PMID: 29523685 Free PMC article.
-
Human Amnion Epithelial Cells Produce Soluble Factors that Enhance Liver Repair by Reducing Fibrosis While Maintaining Regeneration in a Model of Chronic Liver Injury.Cell Transplant. 2020 Jan-Dec;29:963689720950221. doi: 10.1177/0963689720950221. Cell Transplant. 2020. PMID: 32813573 Free PMC article.
-
Regional Differences in Human Biliary Tissues and Corresponding In Vitro-Derived Organoids.Hepatology. 2021 Jan;73(1):247-267. doi: 10.1002/hep.31252. Hepatology. 2021. PMID: 32222998 Free PMC article.
-
Meta-Analysis of Human and Mouse Biliary Epithelial Cell Gene Profiles.Cells. 2019 Sep 20;8(10):1117. doi: 10.3390/cells8101117. Cells. 2019. PMID: 31547151 Free PMC article.
References
-
- Wang X., Foster M., Al-Dhalimy M., Lagasse E., Finegold M., Grompe M. The origin and liver repopulating capacity of murine oval cells. Proceedings of the National Academy of Sciences of the United States of America. 2003;100(supplement 1):11881–11888. doi: 10.1073/pnas.1734199100. - DOI - PMC - PubMed
-
- Yasui O., Miura N., Terada K., Kawarada Y., Koyama K., Sugiyama T. Isolation of oval cells from Long-Evans Cinnamon rats and their transformation into hepatocytes in vivo in the rat liver. Hepatology. 1997;25(2):329–334. - PubMed
Grants and funding
LinkOut - more resources
Full Text Sources
Other Literature Sources
Molecular Biology Databases
Research Materials
Miscellaneous
