. 2016 Oct 19:12:41.
doi: 10.1186/s13007-016-0141-7. eCollection 2016.

Infiltration-RNAseq: transcriptome profiling of Agrobacterium-mediated infiltration of transcription factors to discover gene function and expression networks in plants

Affiliations

Infiltration-RNAseq: transcriptome profiling of Agrobacterium-mediated infiltration of transcription factors to discover gene function and expression networks in plants

Donna M Bond et al. Plant Methods. .

Abstract

Background: Transcription factors (TFs) coordinate precise gene expression patterns that give rise to distinct phenotypic outputs. The identification of genes and transcriptional networks regulated by a TF often requires stable transformation and expression changes in plant cells. However, the production of stable transformants can be slow and laborious with no guarantee of success. Furthermore, transgenic plants overexpressing a TF of interest can present pleiotropic phenotypes and/or result in a high number of indirect gene expression changes. Therefore, fast, efficient, high-throughput methods for assaying TF function are needed.

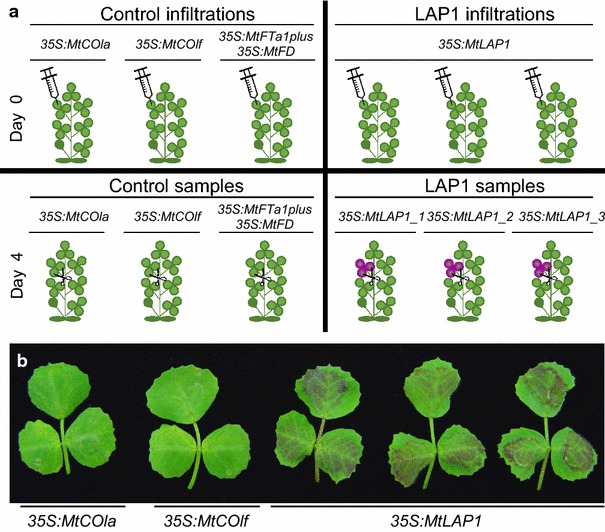
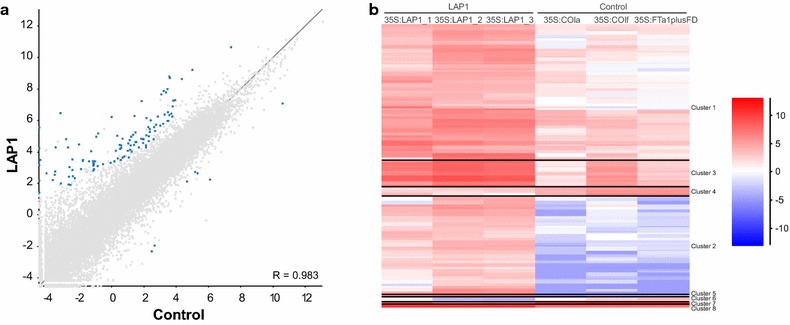
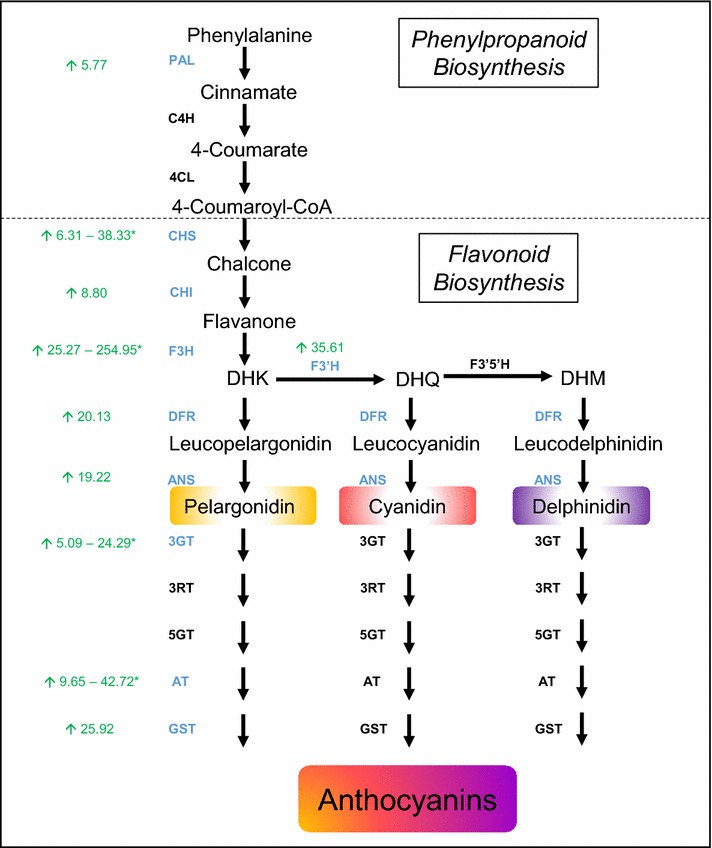
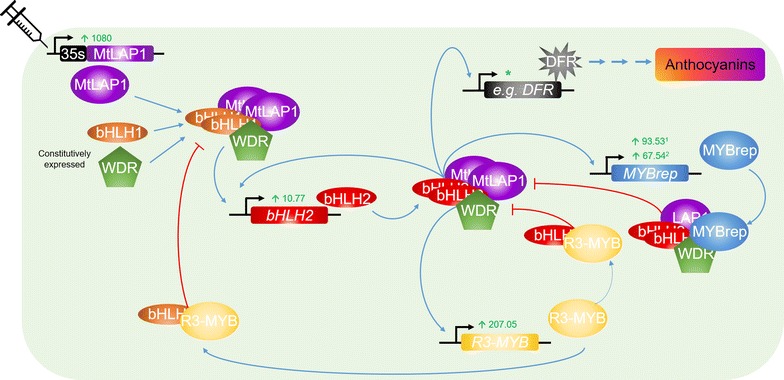
Results: Agroinfiltration is a simple plant biology method that allows transient gene expression. It is a rapid and powerful tool for the functional characterisation of TF genes in planta. High throughput RNA sequencing is now a widely used method for analysing gene expression profiles (transcriptomes). By coupling TF agroinfiltration with RNA sequencing (named here as Infiltration-RNAseq), gene expression networks and gene function can be identified within a few weeks rather than many months. As a proof of concept, we agroinfiltrated Medicago truncatula leaves with M. truncatula LEGUME ANTHOCYANIN PRODUCITION 1 (MtLAP1), a MYB transcription factor involved in the regulation of the anthocyanin pathway, and assessed the resulting transcriptome. Leaves infiltrated with MtLAP1 turned red indicating the production of anthocyanin pigment. Consistent with this, genes encoding enzymes in the anthocyanin biosynthetic pathway, and known transcriptional activators and repressors of the anthocyanin biosynthetic pathway, were upregulated. A novel observation was the induction of a R3-MYB transcriptional repressor that likely provides transcriptional feedback inhibition to prevent the deleterious effects of excess anthocyanins on photosynthesis.

Conclusions: Infiltration-RNAseq is a fast and convenient method for profiling TF-mediated gene expression changes. We utilised this method to identify TF-mediated transcriptional changes and TF target genes in M. truncatula and Nicotiana benthamiana. This included the identification of target genes of a TF not normally expressed in leaves, and targets of TFs from other plant species. Infiltration-RNAseq can be easily adapted to other plant species where agroinfiltration protocols have been optimised. The ability to identify downstream genes, including positive and negative transcriptional regulators, will result in a greater understanding of TF function.

Keywords: Agrobacterium tumefaciens; Anthocyanin; Infiltration; Medicago truncatula; MtLAP1; Nicotiana benthamiana; RNAseq; Transcription factor; Transcriptome.


Figures

Fig. 1
Fig. 1
Agroinfiltration of 35S:MtLAP1 induces anthocyanin pigment production in Medicago truncatula leaves. a Experimental design of M. truncatula MtLAP1 Infiltration-RNAseq experiment. On Day 0 (top) all three leaflets of the 4th trifoliate leaf of healthy 3 weeks old plants were agroinfiltrated (represented by syringe) with ‘Control’ infiltrations (left hand side) or ‘LAP1’ infiltrations (right hand side). For the Control infiltrations, a single plant was infiltrated with either: 35S:MtCOla, 35S:MtCOlf or 35S:MtFTa1plusMtFD [56, 57]. For the LAP1 infiltrations, a triplicate set of plants were infiltrated with 35S: MtLAP1 [25]. Four days post infiltration (bottom), all three leaflets of agroinfiltrated leaves were harvested (represented by scissors) in preparation for RNA extraction and analysis. The resulting control samples were: 35S:MtCOla, 35S: MtCOlf and MtFTa1plusMtFD, and the resulting LAP1 samples (purple leaves due to anthocyanin production) were 35S: MtLAP1_1, 35S: MtLAP1_2 and 35S: MtLAP1_3. b All three leaflets of the 4th trifoliate leaf of healthy 3 weeks old plants were agroinfiltrated with 35S:MtLAP1, 35S:MtCOla or 35S:MtCOlf. The 35S:MtCOla and 35S:MtCOlf constructs overexpress Medicago genes that are not involved in anthocyanin biosynthesis [56, 57] (see “Methods”). Agroinfiltrated leaves were harvested for photographing 4 days post infiltration. Note: these leaves are representative agroinfiltrations and were not used for RNA extraction and downstream analyses
Fig. 2
Fig. 2
Significantly differentially expressed genes between ‘Control’ and ‘LAP1’ agroinfiltration conditions. a Scatter plot showing the correlation for significantly differentially expressed genes between Control (x-axis) and LAP1 (y-axis) replicate sets (Pearson correlation value = 0.983). Differential expression analysis between the two replicate sets was performed on raw counts with annotated mRNAs via the DESeq2 Filter [35] and combined with the Intensity Difference Filter using SeqMonk [62] (see “Methods”). mRNAs were considered significantly differentially expressed when the adjusted P value was <0.05 (blue dots). Grey dots represent all other mRNAs in the M. truncatula genome (version Mt4.0), showing the relationship between the quantitated values in the Control and LAP1 replicate sets. b Hierarchical clustering of differentially expressed genes between ‘Control’ and ‘LAP1’ agroinfiltration conditions. With a correlation coefficient of 0.7, 109 genes fell in to 8 clusters with three major categories: low-moderate expression in control conditions, moderate induction by MtLAP1 infiltration (cluster 1); very low expression in control conditions, induced by MtLAP1 infiltration (cluster 2); moderate expression in control conditions, highly induced in response to MtLAP1 infiltration (cluster 3). Values are log2-transformed library-normalized/median-normalized counts
Fig. 3
Fig. 3
The core pathway for anthocyanin biosynthesis. The general phenylpropanoid pathway is catalysed by phenylalanine ammonia lyase (PAL), cinnamate 4-hydroxylase (C4H) and 4-coumaroyl CoA ligase (4CL). Enzymes involved in flavonoid biosynthesis are chalcone synthase (CHS), chalcone isomerase (CHI), flavanone 3-hydroxylase (F3H), flavanone 3′-hydroxylase (F3′H) and flavanone 3′5′-hydroxylase (F3′5′H), which produce dihydroflavanols: dihydrokaempferol (DHK), dihydroquercetin (DHQ) and dihydromyricetin (DHM), respectively. Anthocyanins are synthesized by dihydroflavanol 4-reductase (DFR) and anthocyanin synthase (ANS), and stabilised by 3-glucosyl-transferase (3GT), 3-rhamnosyl transferase (3RT), 5-glucosyl transferase (5GT) and anthocyanin acyl transferase (AT). Biosynthetic genes identified as being significantly differentially expressed (P value <0.05) are in blue; numbers in green are the fold change of expression observed for each differentially expressed gene between Control and LAP1 conditions (Additional file 1: Table S1); green upward arrow represents upregulation; Asterisk multiple isoforms of genes encoding these enzymes are upregulated
Fig. 4
Fig. 4
Agroinfiltration of MtLAP1 initiates the anthocyanin gene regulatory network in M. truncatula: proposed model. Upon agroinfiltration of 35S:MtLAP1, MtLAP1 can form an MBW activation complex with constitutively expressed bHLH1 (basic helix-loop-helix clade 1; Medtr8g098275) and WDR (WD-repeat proteins; Medtr3g192840 and/or Medtr7g084810) proteins, which activates expression of bHLH2 (basic helix-loop-helix clade 2; Medtr1g072320; MtTT8). A core MBW complex, containing bHLH2, forms that positively autoregulates bHLH2 expression and activates expression of the anthocyanin biosynthetic genes (represented by DFR; dihydroflavanol 4-reductase) resulting in anthocyanin pigment production. The core MBW also activates expression of MYBrep genes (R2R3-MYB; Medtr4g585530/MtMYB530 and Medtr5g079670/MtMYB2) and R3-MYB (Medtr2g088730/MtMYB730). The inclusion of the MYB repressor into the MBW complex results in the transcriptional repression of target promoters of the core MBW complex (bHLH2, MYBrep and R3-MYB). Feedback inhibition is provided by R3-MYB by inhibiting the formation of new MBW complexes by titrating bHLH1 and bHLH2. Numbers in green are the fold change of expression for each gene significantly differentially expressed (P value <0.05; MtLAP1, bHLH2 = Medtr1g072320/MtTT8; MYBrep = Medtr4g485530; R3-MYB = Medtr2g088730/MtMYB730); upward arrow represents upregulation; 1 Medtr4g585530/MtMYB530 MYBrep; 2 Medtr5g079670/MtMYB2 MYBrep; Asterisk See Fig. 3 for fold change expression of biosynthetic genes

References

    1. Zhang JZ. Overexpression analysis of plant transcription factors. Curr Opin Plant Biol. 2003;6:430–440. doi: 10.1016/S1369-5266(03)00081-5. - DOI - PubMed
    1. Prelich G. Gene overexpression: uses, mechanisms, and interpretation. Genetics. 2012;190:841–854. doi: 10.1534/genetics.111.136911. - DOI - PMC - PubMed
    1. Kondou Y, Higuchi M, Matsui M. High-throughput characterization of plant gene functions by using gain-of-function technology. Annu Rev Plant Biol. 2010;61:373–393. doi: 10.1146/annurev-arplant-042809-112143. - DOI - PubMed
    1. Krenek P, Samajova O, Luptovciak I, Doskocilova A, Komis G, Samaj J. Transient plant transformation mediated by Agrobacterium tumefaciens: principles, methods and applications. Biotechnol Adv. 2015;33:1024–1042. doi: 10.1016/j.biotechadv.2015.03.012. - DOI - PubMed
    1. Jones DH, Doherty A, Sparks AC. Transient transformation of plants. Meth Mol Biol. 2009;513:131–152. doi: 10.1007/978-1-59745-427-8_8. - DOI - PubMed