

Long-term variability in sugarcane bagasse feedstock compositional methods: sources and magnitude of analytical variability
- PMID: 27777625
- PMCID: PMC5069941
- DOI: 10.1186/s13068-016-0621-z
Long-term variability in sugarcane bagasse feedstock compositional methods: sources and magnitude of analytical variability
Abstract
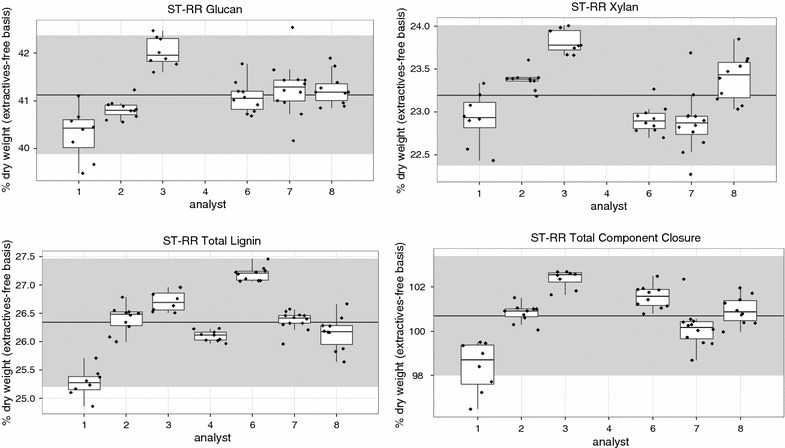
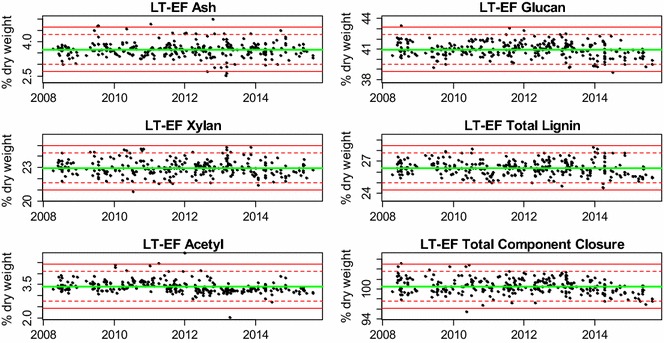
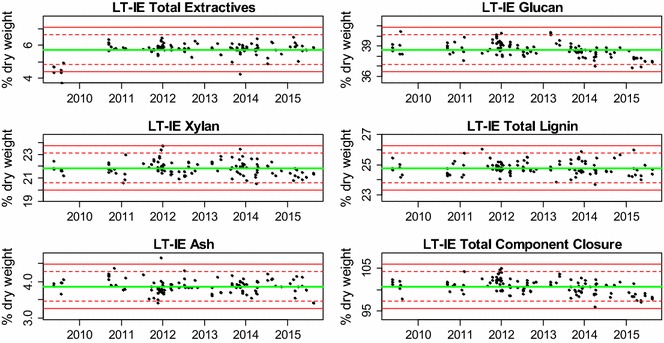
Background: In an effort to find economical, carbon-neutral transportation fuels, biomass feedstock compositional analysis methods are used to monitor, compare, and improve biofuel conversion processes. These methods are empirical, and the analytical variability seen in the feedstock compositional data propagates into variability in the conversion yields, component balances, mass balances, and ultimately the minimum ethanol selling price (MESP). We report the average composition and standard deviations of 119 individually extracted National Institute of Standards and Technology (NIST) bagasse [Reference Material (RM) 8491] run by seven analysts over 7 years. Two additional datasets, using bulk-extracted bagasse (containing 58 and 291 replicates each), were examined to separate out the effects of batch, analyst, sugar recovery standard calculation method, and extractions from the total analytical variability seen in the individually extracted dataset. We believe this is the world's largest NIST bagasse compositional analysis dataset and it provides unique insight into the long-term analytical variability. Understanding the long-term variability of the feedstock analysis will help determine the minimum difference that can be detected in yield, mass balance, and efficiency calculations.
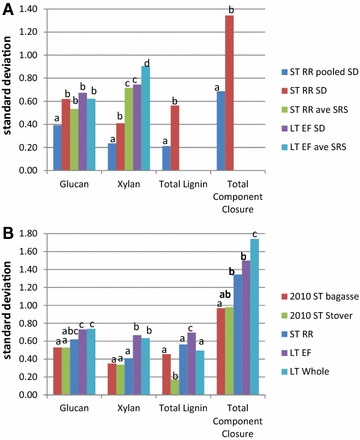
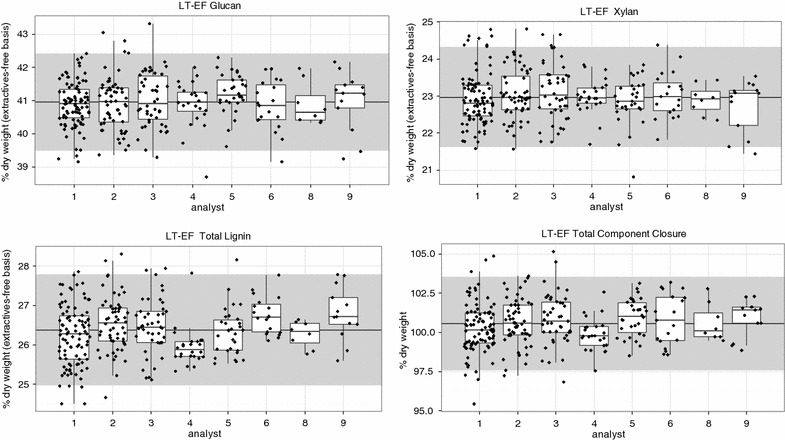
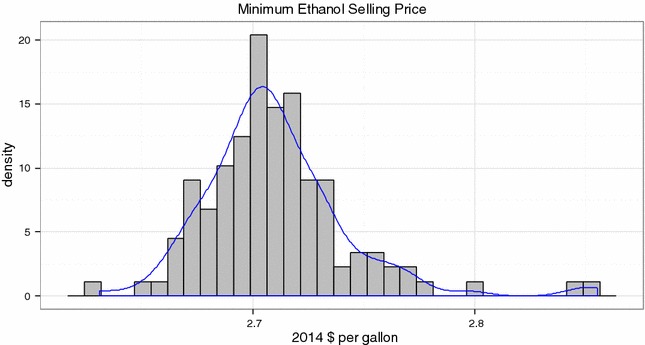
Results: The long-term data show consistent bagasse component values through time and by different analysts. This suggests that the standard compositional analysis methods were performed consistently and that the bagasse RM itself remained unchanged during this time period. The long-term variability seen here is generally higher than short-term variabilities. It is worth noting that the effect of short-term or long-term feedstock compositional variability on MESP is small, about $0.03 per gallon.
Conclusions: The long-term analysis variabilities reported here are plausible minimum values for these methods, though not necessarily average or expected variabilities. We must emphasize the importance of training and good analytical procedures needed to generate this data. When combined with a robust QA/QC oversight protocol, these empirical methods can be relied upon to generate high-quality data over a long period of time.
Keywords: Biofuels; Compositional analysis; MESP; NIST RM 8491; Sugarcane bagasse; Variability.
Figures
Similar articles
-
Compositional Analysis of Biomass Reference Materials: Results from an Interlaboratory Study.Bioenergy Res. 2016 Mar;9(1):303-314. doi: 10.1007/s12155-015-9675-1. Epub 2015 Oct 29. Bioenergy Res. 2016. PMID: 27019676 Free PMC article.
-
Effect of corn stover compositional variability on minimum ethanol selling price (MESP).Bioresour Technol. 2013 Jul;140:426-30. doi: 10.1016/j.biortech.2013.04.083. Epub 2013 Apr 30. Bioresour Technol. 2013. PMID: 23706349
-
Compositional analysis of lignocellulosic feedstocks. 2. Method uncertainties.J Agric Food Chem. 2010 Aug 25;58(16):9054-62. doi: 10.1021/jf100807b. Epub 2010 Jul 29. J Agric Food Chem. 2010. PMID: 20669952 Free PMC article.
-
Biomass compositional analysis for energy applications.Methods Mol Biol. 2009;581:145-67. doi: 10.1007/978-1-60761-214-8_11. Methods Mol Biol. 2009. PMID: 19768622 Review.
-
Review on Bioenergy Storage Systems for Preserving and Improving Feedstock Value.Front Bioeng Biotechnol. 2020 Apr 28;8:370. doi: 10.3389/fbioe.2020.00370. eCollection 2020. Front Bioeng Biotechnol. 2020. PMID: 32411689 Free PMC article. Review.
References
-
- Brethauer S, Wyman CE. Review: Continuous hydrolysis and fermentation for cellulosic ethanol production. Bioresour Technol [Internet]. Elsevier Ltd; 2010; 101:4862–74. http://www.ncbi.nlm.nih.gov/pubmed/20006926. Accessed 10 Jul 2014. - PubMed
-
- Chundawat SPS, Beckham GT, Himmel ME, Dale BE. Deconstruction of lignocellulosic biomass to fuels and chemicals. Annu Rev Chem Biomol Eng [Internet]. 2011; 2:121–45. http://www.ncbi.nlm.nih.gov/pubmed/22432613. Accessed 16 Jul 2014. - PubMed
-
- Huang R, Su R, Qi W, He Z. Bioconversion of lignocellulose into bioethanol: process intensification and mechanism research. Bioenergy Res. 2011;4(4):225–245. doi: 10.1007/s12155-011-9125-7. - DOI
-
- Ragauskas AJ, Williams CK, Davison BH, Britovsek G, Cairney J, Eckert C a, et al. The path forward for biofuels and biomaterials. Science [Internet]. 2006; 311:484–9. http://www.ncbi.nlm.nih.gov/pubmed/16439654. Accessed 9 Jul 2014. - PubMed
-
- Sims REH, Mabee W, Saddler JN, Taylor M. An overview of second generation biofuel technologies. Bioresour Technol [Internet]. Elsevier Ltd. 2010; 101:1570–80. http://www.ncbi.nlm.nih.gov/pubmed/19963372. Accessed 11 Jul 2014. - PubMed
LinkOut - more resources
Full Text Sources
Other Literature Sources
