. 2016 Oct 12:8:106.
doi: 10.1186/s13148-016-0274-6. eCollection 2016.

Global DNA methylation profiling reveals new insights into epigenetically deregulated protein coding and long noncoding RNAs in CLL

Affiliations

Global DNA methylation profiling reveals new insights into epigenetically deregulated protein coding and long noncoding RNAs in CLL

Santhilal Subhash et al. Clin Epigenetics. .

Abstract

Background: Methyl-CpG-binding domain protein enriched genome-wide sequencing (MBD-Seq) is a robust and powerful method for analyzing methylated CpG-rich regions with complete genome-wide coverage. In chronic lymphocytic leukemia (CLL), the role of CpG methylated regions associated with transcribed long noncoding RNAs (lncRNA) and repetitive genomic elements are poorly understood. Based on MBD-Seq, we characterized the global methylation profile of high CpG-rich regions in different CLL prognostic subgroups based on IGHV mutational status.

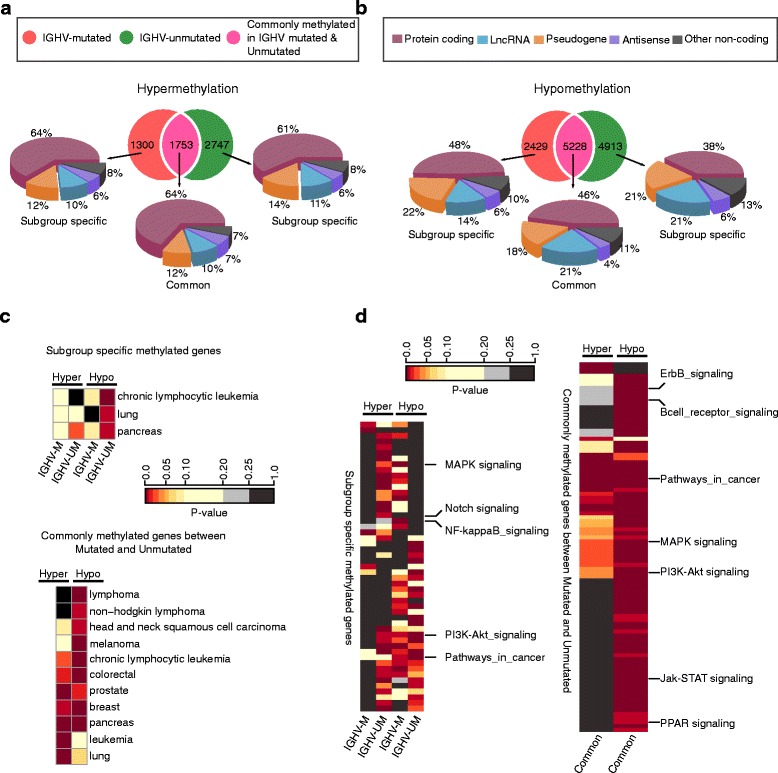
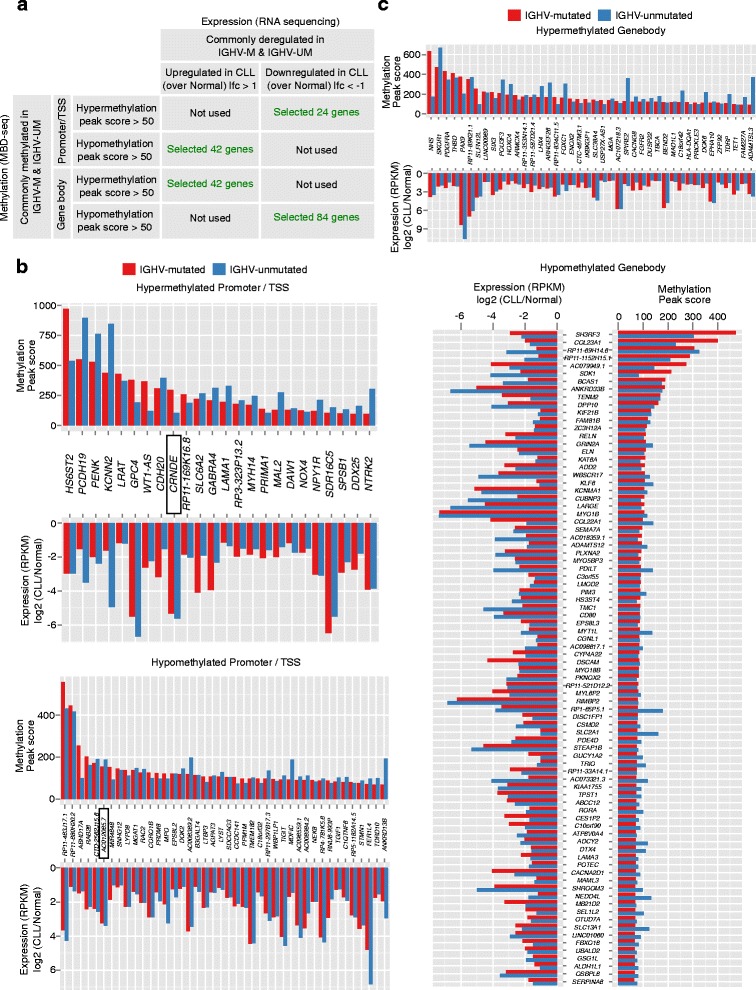
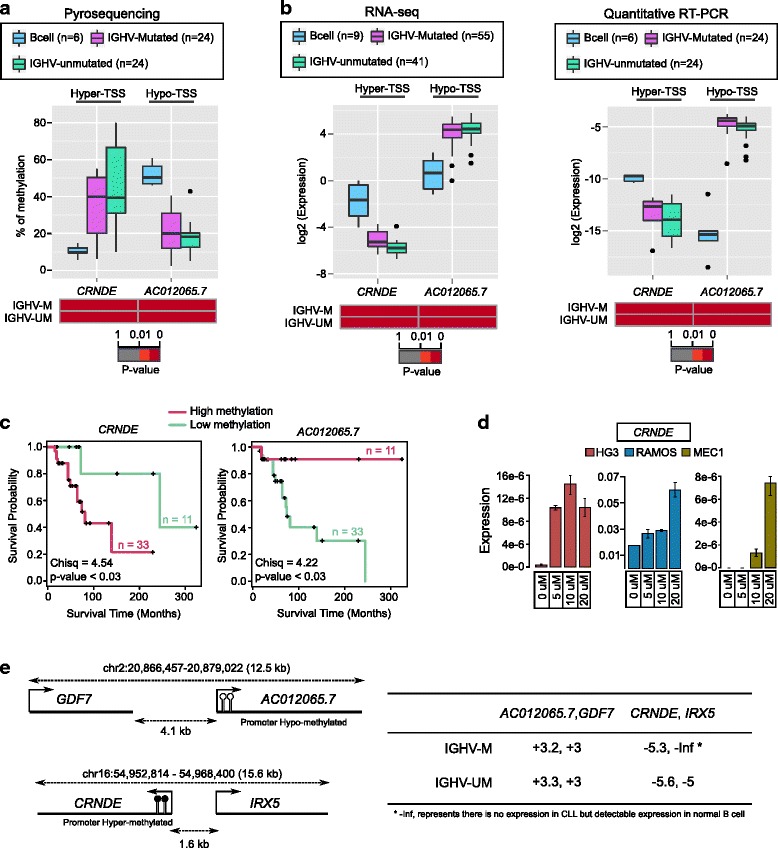
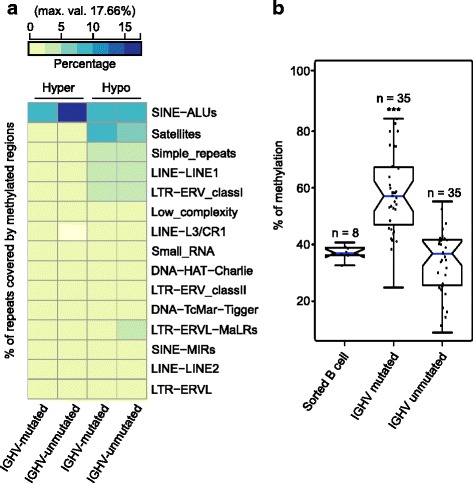
Results: Our study identified 5800 hypermethylated and 12,570 hypomethylated CLL-specific differentially methylated genes (cllDMGs) compared to normal controls. From cllDMGs, 40 % of hypermethylated and 60 % of hypomethylated genes were mapped to noncoding RNAs. In addition, we found that the major repetitive elements such as short interspersed elements (SINE) and long interspersed elements (LINE) have a high percentage of cllDMRs (differentially methylated regions) in IGHV subgroups compared to normal controls. Finally, two novel lncRNAs (hypermethylated CRNDE and hypomethylated AC012065.7) were validated in an independent CLL sample cohort (48 samples) compared with 6 normal sorted B cell samples using quantitative pyrosequencing analysis. The methylation levels showed an inverse correlation to gene expression levels analyzed by real-time quantitative PCR. Notably, survival analysis revealed that hypermethylation of CRNDE and hypomethylation of AC012065.7 correlated with an inferior outcome.

Conclusions: Thus, our comprehensive methylation analysis by MBD-Seq provided novel hyper and hypomethylated long noncoding RNAs, repetitive elements, along with protein coding genes as potential epigenetic-based CLL-signature genes involved in disease pathogenesis and prognosis.

Keywords: Chronic lymphocytic leukemia; DNA methylation; Hyper/hypomethylated regions; Repetitive elements and noncoding RNAs.


Figures

Fig. 1
Fig. 1
The global methylation levels and identification of differentially methylated regions (DMRs) in CLL patient samples. a, b Analysis pipeline used to find CLL-associated differentially methylated regions (DMRs). c Differentially methylated regions (DMRs, hypermethylated and hypomethylated) in IGHV-mutated and IGHV-unmutated samples over sorted B cells and normal PBMC. The enrichments shown in the heatmap were within a ±3 kb window from differentially methylated region (DMRs). d The bar graph shows the overall percentage of genome covered by in normal and prognostic CLL groups. e The bar graphs in (e) show the difference in distribution of hypermethylated and hypomethylated patterns across the genome. The peaks used for assigning the genomic regions were derived from MACS with a significance of p < 1E−05
Fig. 2
Fig. 2
Association of DMRs to genes and the importance of associated genes (DMGs) in CLL over normal sorted B cell. a, b Venn diagram shows the overlap of differentially methylated genes (DMGs, hypermethylated and hypomethylated) between IGHV-mutated and IGHV-unmutated groups. The pie chart represents the percentage of different classes of genes such as protein coding, lncRNA, pseudogenes, antisense and other noncoding RNAs. c The heatmap shows enrichment of DMGs (top, subgroup specific and bottom, common DMGs) in different cancer types from Network of Cancer Genes (NCG 4.0). The cancer types are assigned and ranked using GeneSCF. The presented enrichment was filtered using a p value <0.01 with at least 5 % of total cancer genes covered by DMGs. d The heatmap shows the KEGG pathways obtained using DMGs from IGHV-mutated and IGHV-unmutated prognostic groups. The pathways were assigned and ranked using GeneSCF. The presented pathways are filtered using a p value <0.01 with at least 5 % of total pathway genes covered by DMGs (see the “Methods” section). The left side of the heatmap represents the subgroup specific (IGHV-mutated and IGHV-unmutated) hyper- and hypomethylated associated pathways; and the right side of the heatmap for common DMGs between IGHV-mutated and IGHV-unmutated groups (see the “Methods” section)
Fig. 3
Fig. 3
Regulation of cllDMGs by the distribution of methylation on gene structure and the gene expression patterns associated with methylation. a Table showing the selection of candidate genes depending on correlation between location of methylation on gene structure (promoter or gene body methylation in MBD-seq) and their pattern of gene expression (up or downregulated in RNA-seq, log2fold-change). The “selected number of genes” in green represents the candidate genes (cllDMGs) considered for further investigation. The two selected genes (CRNDE and AC012065.7) for further investigation from two categories were highlighted in bar graphs (b and c) with a rectangle. b The top and bottom bar graphs represent the list of selected cllDMGs from promoter-hypermethylated-downregulated and promoter-hypomethylated-upregulated patterns, respectively. c The top and bottom bar graphs show the list of selected cllDMGs from gene body-hypermethylated-upregulated and gene body-hypomethylated-downregulated patterns, respectively
Fig. 4
Fig. 4
Validation of differential methylation and expression levels in CLL cohorts. a Boxplots on top shows the difference in distribution and level of methylation between IGHV-mutated, IGHV-unmutated, and sorted B cells for two selected genes (CRNDE and AC012065.7) obtained using pyrosequencing. b The boxplots shows the difference in gene expression levels between IGHV-mutated, IGHV-unmutated, and sorted B cells for same genes obtained using published RNA sequencing dataset (Ferreira PG et al.) and quantitative RT-PCR. The heatmap below each boxplot shows the significance level (p value) of the corresponding gene over B cell (IGHV-M, IGHV-mutated, and IGHV-UM, IGHV-unmutated). c Kaplan-Meier plots showing the clinical significance of all the validated genes based on high and low methylation levels. The high and low levels were calculated using upper and lower quartile based method for all the genes in total 44 CLL patient samples. d Gene expression levels of CRNDE using increasing concentrations of DAC treatment in different leukemic cell lines. e The illustrations (left panel) represents the protein coding genes IRX5 and GDF7 within 10-kb proximity of selected lncRNAs CRNDE and AC012065.7, respectively. The expression values for these lncRNAs and nearby protein coding genes are presented in right panel of the figure. The values in the panel represents log2-fold change in comparison between normal B cell and CLL groups (96 patients cohort, 55 IGHV-mutated, and 41 IGHV-unmutated), positive values means expression is more in CLL groups and vice versa
Fig. 5
Fig. 5
CLL-associated differentially methylated repeat elements (DMrE) over normal sorted B cell. a The heatplot represents the enrichment of cllDMRs over different repeat elements in B cell comparison. b Validation of IGHV-mutated specific hypermethylated SINE-ALU repeat region in 70 CLL patient samples and 8 normal B cell controls using pyrosequencing method. Statistical significance was derived using unpaired Student’s t test, *p < 0.05, **p < 0.01, and ***p < 0.001

Similar articles

Cited by

References

    1. Damle RN, Wasil T, Fais F, Ghiotto F, Valetto A, Allen SL, Buchbinder A, Budman D, Dittmar K, Kolitz J, et al. Ig V gene mutation status and CD38 expression as novel prognostic indicators in chronic lymphocytic leukemia. Blood. 1999;94:1840–7. - PubMed
    1. Hamblin TJ, Davis Z, Gardiner A, Oscier DG, Stevenson FK. Unmutated Ig V (H) genes are associated with a more aggressive form of chronic lymphocytic leukemia. Blood. 1999;94:1848–54. - PubMed
    1. Kanduri M, Cahill N, Goransson H, Enstrom C, Ryan F, Isaksson A, Rosenquist R. Differential genome-wide array-based methylation profiles in prognostic subsets of chronic lymphocytic leukemia. Blood. 2010;115:296–305. doi: 10.1182/blood-2009-07-232868. - DOI - PubMed
    1. Halldorsdottir AM, Kanduri M, Marincevic M, Mansouri L, Isaksson A, Goransson H, Axelsson T, Agarwal P, Jernberg-Wiklund H, Stamatopoulos K, et al. Mantle cell lymphoma displays a homogenous methylation profile: a comparative analysis with chronic lymphocytic leukemia. Am J Hematol. 2012;87:361–7. doi: 10.1002/ajh.23115. - DOI - PubMed
    1. Cahill N, Bergh AC, Kanduri M, Goransson-Kultima H, Mansouri L, Isaksson A, Ryan F, Smedby KE, Juliusson G, Sundstrom C, et al. 450 K-array analysis of chronic lymphocytic leukemia cells reveals global DNA methylation to be relatively stable over time and similar in resting and proliferative compartments. Leuk Off J Leuk Soc Am Leuk Res Fund UK. 2013;27:150–8. doi: 10.1038/leu.2012.245. - DOI - PubMed

Publication types

MeSH terms

LinkOut - more resources