

Maternal vitamin D depletion alters DNA methylation at imprinted loci in multiple generations
- PMID: 27777636
- PMCID: PMC5062906
- DOI: 10.1186/s13148-016-0276-4
Maternal vitamin D depletion alters DNA methylation at imprinted loci in multiple generations
Abstract
Background: Environmental perturbation of epigenetic mechanisms is linked to a growing number of diseases. Characterizing the role environmental factors play in modifying the epigenome is important for disease etiology. Vitamin D is an essential nutrient affecting brain, bone, heart, immune and reproductive health. Vitamin D insufficiency is a global issue, and the role in maternal and child health remains under investigation.
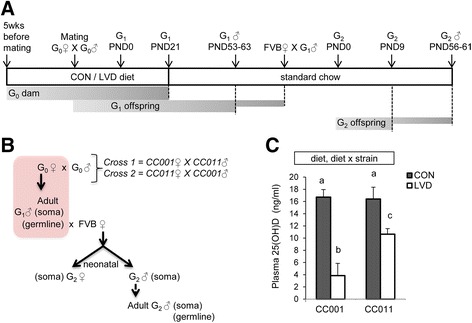
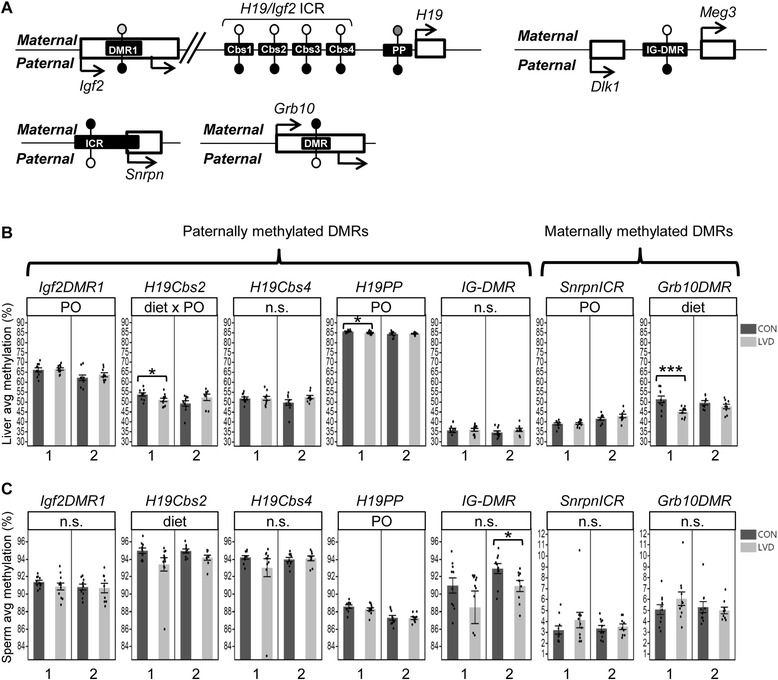
Methods: We used Collaborative Cross (CC) inbred mice to characterize the effect of maternal vitamin D depletion on offspring phenotypic and epigenetic outcomes at imprinted domains (H19/Igf2, Snrpn, Dlk1/Gtl2, and Grb10) in the soma (liver) and germline (sperm). We assessed outcomes in two generations of offspring to determine heritability. We used reciprocal crosses between lines CC001/Unc and CC011/Unc to investigate parent of origin effects.
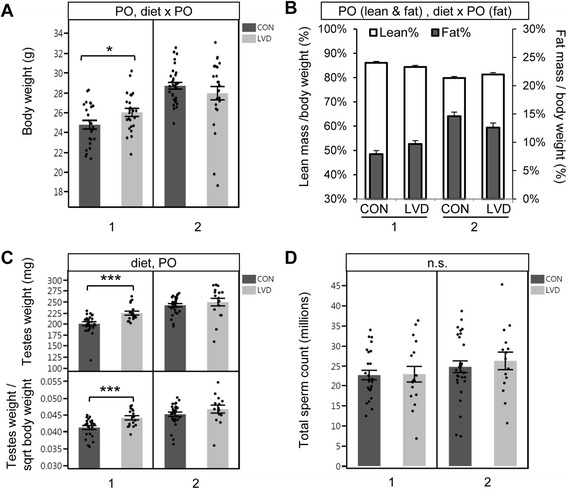
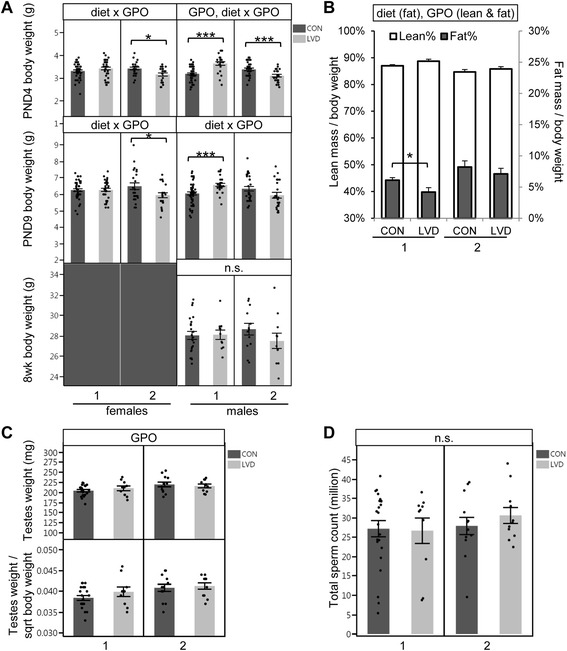
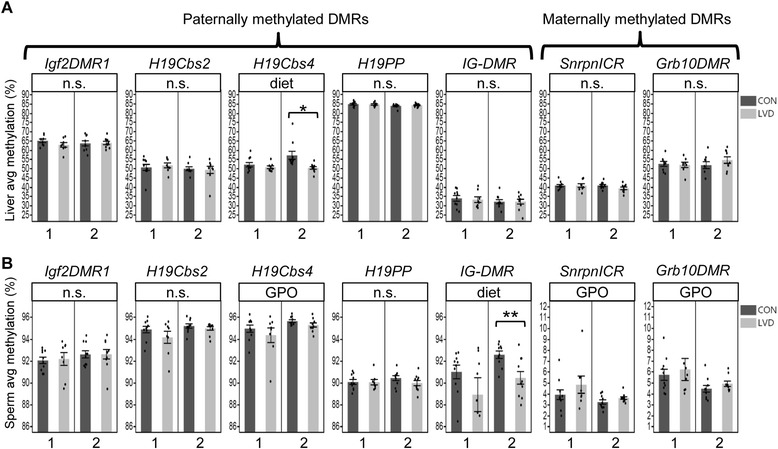
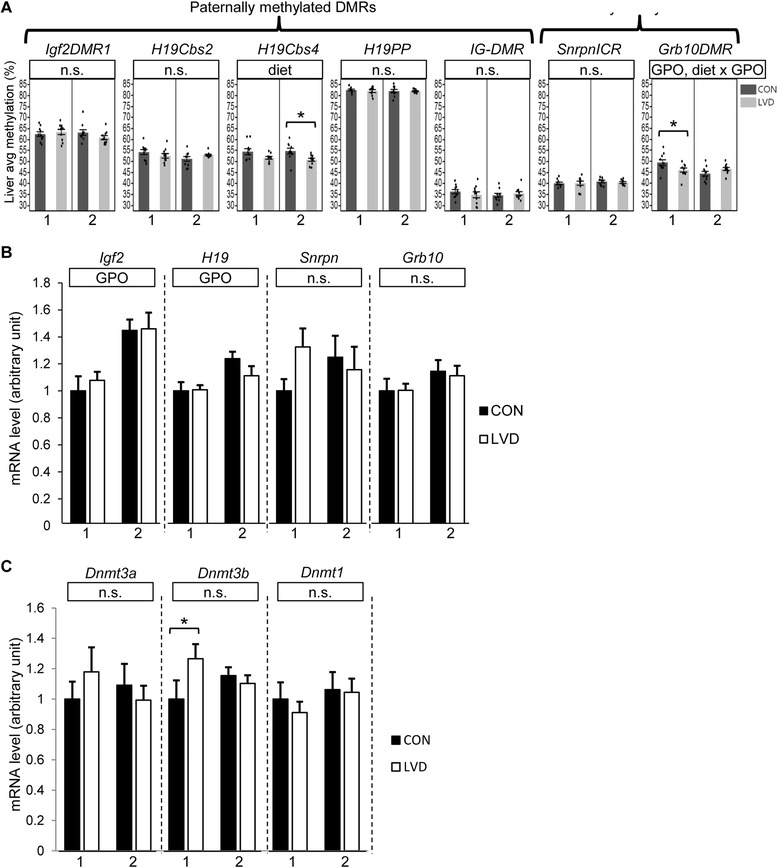
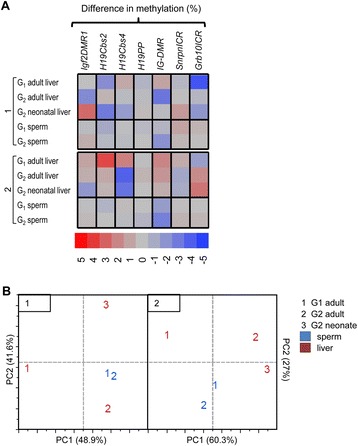
Results: Maternal vitamin D deficiency led to altered body weight and DNA methylation in two generations of offspring. Loci assayed in adult liver and sperm were mostly hypomethylated, but changes were few and small in effect size (<7 % difference on average). There was no change in total expression of genes adjacent to methylation changes in neonatal liver. Methylation changes were cell type specific such that changes at IG-DMR were present in sperm but not in liver. Some methylation changes were distinct between generations such that methylation changes at the H19ICR in second-generation liver were not present in first-generation sperm or liver. Interestingly, some diet-dependent changes in body weight and methylation were seemingly influenced by parent of origin such that reciprocal crosses exhibited inverse effects.
Conclusions: These findings demonstrate that maternal vitamin D status plays a role in determining DNA methylation state in the germline and soma. Detection of methylation changes in the unexposed second-generation demonstrates that maternal vitamin D depletion can have long-term effects on the epigenome of subsequent generations. Differences in vitamin D-dependent epigenetic state between cell types and generations indicate perturbation of the epigenetic landscape rather than a targeted, locus-specific effect. While the biological importance of these subtle changes remains unclear, they warrant an investigation of epigenome-wide effects of maternal vitamin D depletion.
Keywords: Collaborative Cross; Epigenetic inheritance; Imprinting; Maternal diet; Parent of origin; Vitamin D.
Figures
Similar articles
-
Intergenerational impact of paternal lifetime exposures to both folic acid deficiency and supplementation on reproductive outcomes and imprinted gene methylation.Mol Hum Reprod. 2017 Jul 1;23(7):461-477. doi: 10.1093/molehr/gax029. Mol Hum Reprod. 2017. PMID: 28535307 Free PMC article.
-
Impact of vitamin D depletion during development on mouse sperm DNA methylation.Epigenetics. 2018;13(9):959-974. doi: 10.1080/15592294.2018.1526027. Epub 2018 Oct 21. Epigenetics. 2018. PMID: 30239288 Free PMC article.
-
Paternal benzo[a]pyrene exposure alters the sperm DNA methylation levels of imprinting genes in F0 generation mice and their unexposed F1-2 male offspring.Chemosphere. 2019 Aug;228:586-594. doi: 10.1016/j.chemosphere.2019.04.092. Epub 2019 Apr 28. Chemosphere. 2019. PMID: 31059956
-
Age-associated epigenetic changes in mammalian sperm: implications for offspring health and development.Hum Reprod Update. 2023 Jan 5;29(1):24-44. doi: 10.1093/humupd/dmac033. Hum Reprod Update. 2023. PMID: 36066418 Free PMC article. Review.
-
Epigenetics, spermatogenesis and male infertility.Mutat Res. 2011 May-Jun;727(3):62-71. doi: 10.1016/j.mrrev.2011.04.002. Epub 2011 Apr 16. Mutat Res. 2011. PMID: 21540125 Review.
Cited by
-
The early life exposome and autism risk: a role for the maternal microbiome?Gut Microbes. 2024 Jan-Dec;16(1):2385117. doi: 10.1080/19490976.2024.2385117. Epub 2024 Aug 9. Gut Microbes. 2024. PMID: 39120056 Free PMC article. Review.
-
The Implications of Vitamin D Status During Pregnancy on Mother and her Developing Child.Front Endocrinol (Lausanne). 2018 Aug 31;9:500. doi: 10.3389/fendo.2018.00500. eCollection 2018. Front Endocrinol (Lausanne). 2018. PMID: 30233496 Free PMC article. Review.
-
Colonic Bacteroides are positively associated with trabecular bone structure and programmed by maternal vitamin D in male but not female offspring in an obesogenic environment.Int J Obes (Lond). 2018 Apr;42(4):696-703. doi: 10.1038/ijo.2017.294. Epub 2017 Nov 30. Int J Obes (Lond). 2018. PMID: 29188819
-
Embryonic vitamin D deficiency programs hematopoietic stem cells to induce type 2 diabetes.Nat Commun. 2023 Jun 13;14(1):3278. doi: 10.1038/s41467-023-38849-z. Nat Commun. 2023. PMID: 37311757 Free PMC article.
-
Prenatal vitamin D deficiency exposure leads to long-term changes in immune cell proportions.Sci Rep. 2024 Aug 27;14(1):19899. doi: 10.1038/s41598-024-70911-8. Sci Rep. 2024. PMID: 39191975 Free PMC article.
References
-
- Kato Y, Rideout WM, 3rd, Hilton K, Barton SC, Tsunoda Y, Surani MA. Developmental potential of mouse primordial germ cells. Development. 1999;126:1823–1832. - PubMed
-
- Smith FM, Holt LJ, Garfield AS, Charalambous M, Koumanov F, Perry M, et al. Mice with a disruption of the imprinted Grb10 gene exhibit altered body composition, glucose homeostasis, and insulin signaling during postnatal life. Mol Cell Biol. 2007;27:5871–5886. doi: 10.1128/MCB.02087-06. - DOI - PMC - PubMed
Publication types
MeSH terms
Grants and funding
LinkOut - more resources
Full Text Sources
Other Literature Sources
Medical
Molecular Biology Databases
Miscellaneous
