. 2016 Sep 28;4(3):175-191.
doi: 10.14218/JCTH.2016.00009. Epub 2016 Jul 8.

PNPLA3 as a Genetic Determinant of Risk for and Severity of Non-alcoholic Fatty Liver Disease Spectrum

Affiliations

PNPLA3 as a Genetic Determinant of Risk for and Severity of Non-alcoholic Fatty Liver Disease Spectrum

Habeeb Salameh et al. J Clin Transl Hepatol. .

Abstract

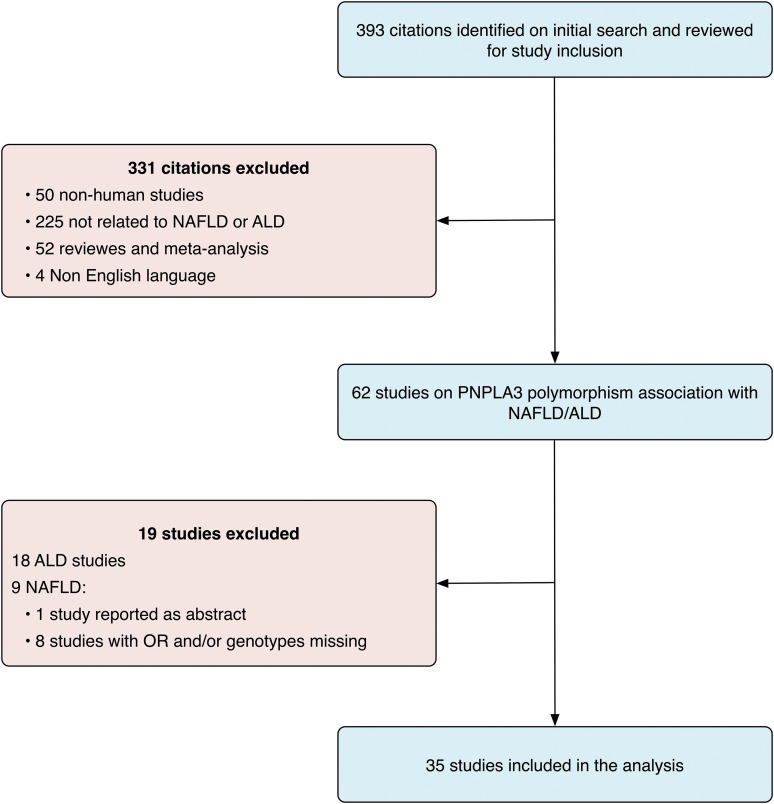
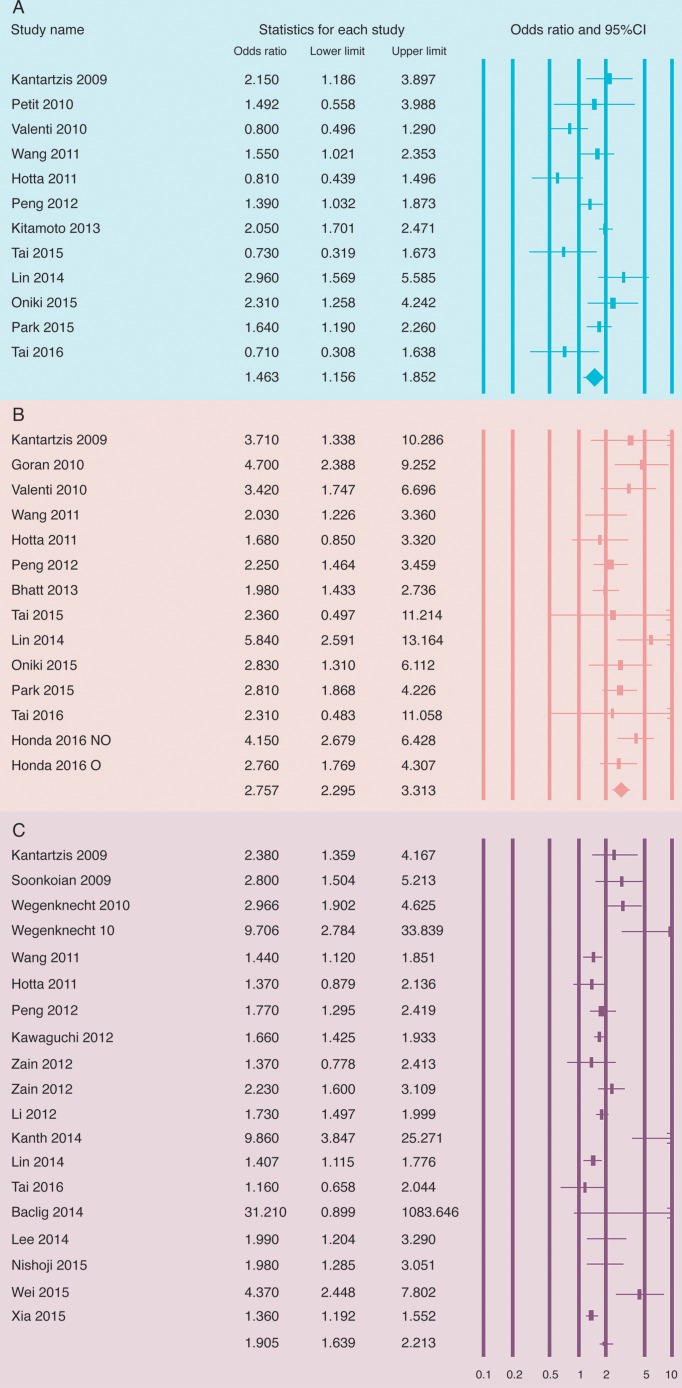
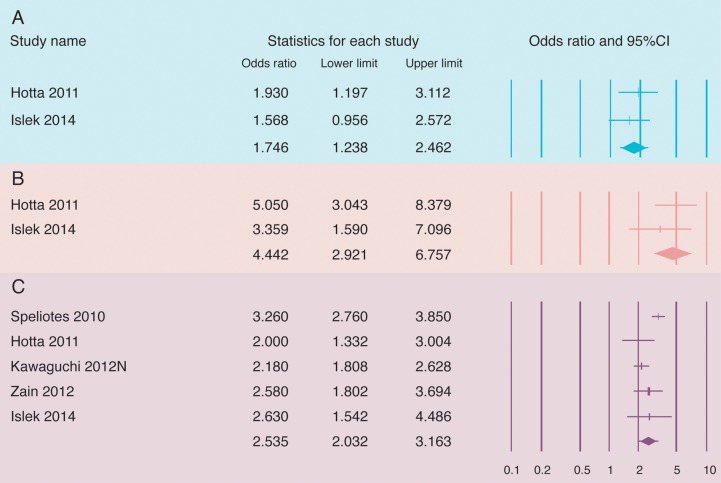
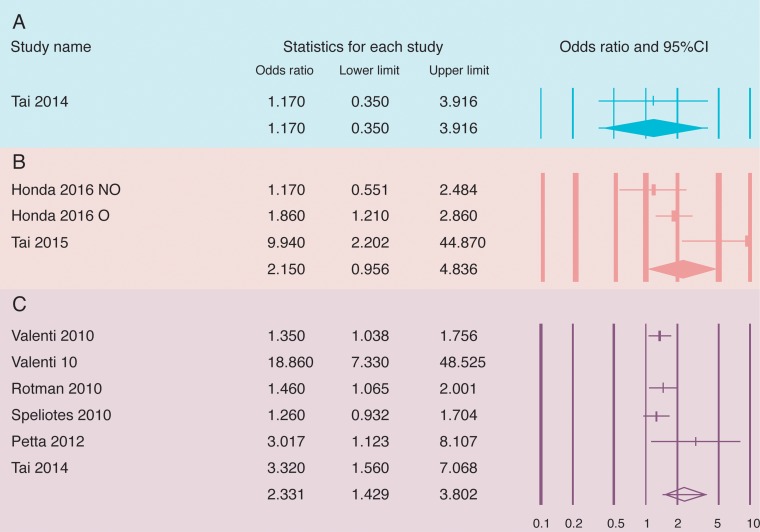
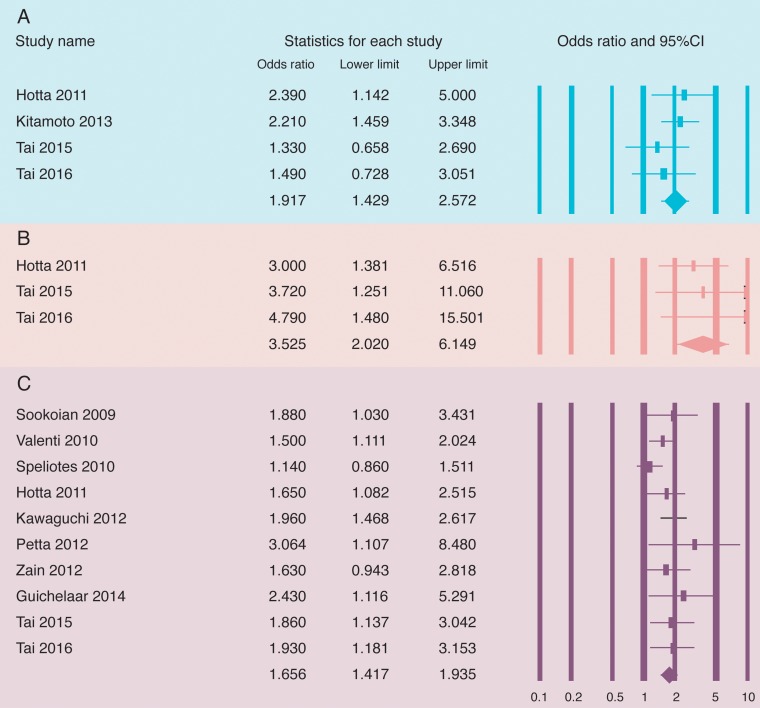
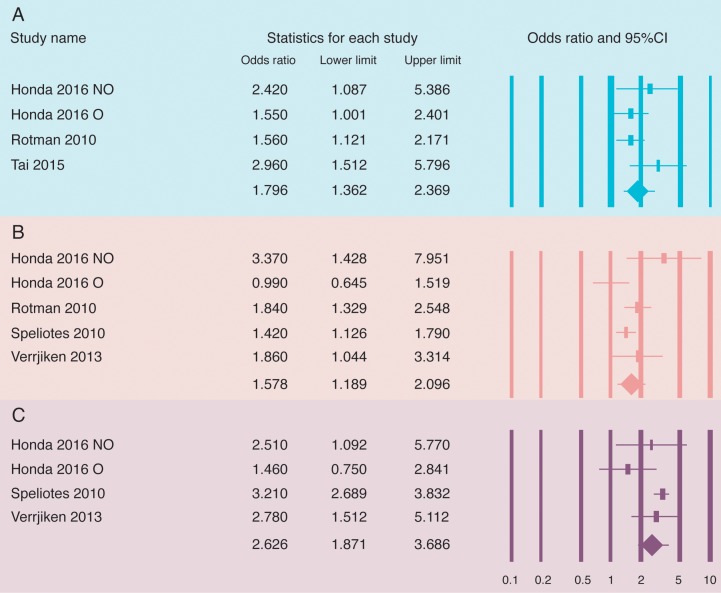
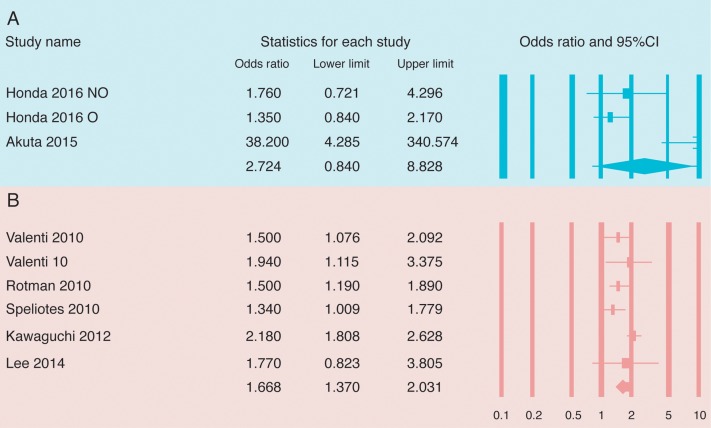
Background and Aims:Patatin-like phospholipase domain protein 3 (PNPLA3) polymorphisms (rs738409 C>G) are associated with non-alcoholic fatty liver disease (NAFLD). We performed a systematic review and meta-analysis to examine the association of PNPLA3 polymorphisms with the spectrum and severity of this disease. Methods: Studies evaluating the association between the PNPLA3 polymorphism spectrum (fatty liver, steatohepatitis, cirrhosis, and hepatocellular carcinoma) and NAFLD were included. Pooled data are reported as odds ratios (ORs) with 95% confidence intervals. Results: Of 393 potentially relevant studies, 35 on NAFLD were included in the analysis. Compared to healthy controls, the pooled ORs for rs738409 CG and GG compared to CC among patients with non-alcoholic fatty liver (NAFL) were 1.46 (1.16-1.85) and 2.76 (2.30-3.13), and were 1.75 (1.24-2.46) and 4.44 (2.92-6.76) among patients with non-alcoholic steatohepatitis respectively. The respective ORs for CG and GG compared to the CC genotype were 2.35 (0.90-6.13) and 5.05 (1.47-17.29) when comparing non-alcoholic hepatocellular carcinoma to NAFL patients. Among the NAFLD patients, the ORs for G allele frequency when comparing steatosis grade 2-3 to grade 0-1 NAFL, when comparing the NAFLD activity score of ≥ 4 to score ≤ 3, when comparing NASH to NAFLD, when comparing the presence of lobular inflammation to absence, and when comparing the presence of hepatocyte ballooning to absence were 2.33 (1.43-3.80), 1.80 (1.36-2.37), 1.66 (1.42-1.94), 1.58 (1.19-2.10), and 2.63 (1.87-3.69) respectively. Subgroup analysis based on ethnicity showed similar results. Conclusions:PNPLA3 polymorphisms have strong association with the risk for and severity of NAFLDs. PNPLA3 polymorphism plays an evolving role in diagnosis and treatment decisions in patients with NAFLD.

Keywords: Non-alcoholic liver disease; PNPLA3; Polymorphisms; rs738409 C>G.


Conflict of interest statement

None

Figures

Fig. 1.
Fig. 1.. Literature search and study inclusion.
Fig. 2.
Fig. 2.. Forest plots for analysis of non-alcoholic fatty liver studies comparing patients to healthy controls for association of PNPLA3 polymorphisms with non-alcoholic fatty liver: A) CG vs. CC, B) GG vs. CC, and C) G allele.
The bottom line in the “statistics for each study” represents the pooled effect size that was analyzed using the random effects model. An OR > 1 denotes risk for the respective outcome or positive association and an OR < 1 indicates a protective effect or negative association. A 95% confidence interval not crossing 1 indicates a significant association. NO, non-obese; O, obese.
Fig. 3.
Fig. 3.. Forest plots for analysis of non-alcoholic fatty liver studies comparing patients to healthy controls for association of PNPLA3 polymorphisms with non-alcoholic steatohepatitis: A) CG vs. CC, B) GG vs. CC, and C) G allele frequency.
The effect size is reported as odds ratio with 95% confidence interval. The bottom line in the “statistics for each study” represents the pooled effect size that was analyzed using the random effects model. An OR > 1 denotes risk for the respective outcome or positive association and an OR < 1 indicates a protective effect or negative association. A 95% confidence interval not crossing 1 indicates a significant association.
Fig. 4.
Fig. 4.. Forest plots for analysis of the risk of spectrum of non-alcoholic fatty liver disease on the association of PNPLA3 polymorphism with steatosis grades 2–3 vs. 0–1: A) CG vs. CC, B) GG vs. CC, and C) G allele frequency.
The bottom line in the “statistics for each study” represents the pooled effect size that was analyzed using the random effects model. An OR > 1 denotes risk for the respective outcome or positive association and an OR < 1 indicates a protective effect or negative association. A 95% confidence interval not crossing 1 indicates a significant association. NO, non-obese; O, obese. Valenti 10 refers to the pediatric study.
Fig. 5.
Fig. 5.. Forest plots for analysis of the risk of spectrum of non-alcoholic fatty liver disease on the association of PNPLA3 polymorphism with non-alcoholic steatohepatitis vs. non-alcoholic fatty liver: A) CG vs. CC, B) GG vs. CC, and C) G allele frequency.
The bottom line in the “statistics for each study” represents the pooled effect size that was analyzed using the random effects model. An OR > 1 denotes risk for the respective outcome or positive association and an OR < 1 indicates a protective effect or negative association. A 95% confidence interval not crossing 1 indicates a significant association.
Fig. 6.
Fig. 6.. Forest plots for analysis of the risk of spectrum of non-alcoholic fatty liver disease on the association of PNPLA3 polymorphism with G allele frequency in NAFLD activity score in panel (A), in lobular inflammation in panel (B) and in hepatocyte ballooning in panel (C).
The bottom line in the “statistics for each study” represents the pooled effect size that was analyzed using the random effects model. An OR > 1 denotes risk for the respective outcome or positive association and an OR < 1 indicates a protective effect or negative association. A 95% confidence interval not crossing 1 indicates a significant association. NO, non-obese; O, obese.
Fig. 7.
Fig. 7.. Forest plots for analysis of the risk of spectrum of non-alcoholic fatty liver disease on the association of PNPLA3 polymorphism with fibrosis/cirrhosis vs. NAFLD: A) GG vs CC, and B) G allele frequency.
The bottom line in the “statistics for each study” represents the pooled effect size that was analyzed using the random effects model. An OR > 1 denotes risk for the respective outcome or positive association and an OR < 1 indicates protective effect or negative association. A 95% confidence interval not crossing 1 indicates a significant association. NO, non-obese; O, obese. Valenti 10 refers to the pediatric study.

References

    1. Singal AK, Guturu P, Hmoud B, Kuo YF, Salameh H, Wiesner RH. Evolving frequency and outcomes of liver transplantation based on etiology of liver disease. Transplantation. 2013;95:755–760. . - DOI - PubMed
    1. Charlton MR, Burns JM, Pedersen RA, Watt KD, Heimbach JK, Dierkhising RA. Frequency and outcomes of liver transplantation for nonalcoholic steatohepatitis in the United States. Gastroenterology. 2011;141:1249–1253. . - DOI - PubMed
    1. Kotronen A, Johansson LE, Johansson LM, Roos C, Westerbacka J, Hamsten A, et al. A common variant in PNPLA3, which encodes adiponutrin, is associated with liver fat content in humans. Diabetologia. 2009;52:1056–1060. . - DOI - PubMed
    1. Salameh H, Raff E, Erwin A, Seth D, Nischalke HD, Falleti E, et al. PNPLA3 gene polymorphism is associated with predisposition to and severity of alcoholic liver disease. Am J Gastroenterol. 2015;110:846–856. . - DOI - PubMed
    1. Kienesberger PC, Oberer M, Lass A, Zechner R. Mammalian patatin domain containing proteins: a family with diverse lipolytic activities involved in multiple biological functions. J Lipid Res. 2009;50(Suppl):S63–S68. . - DOI - PMC - PubMed