. 2016 Oct 20;1(17):e88628.
doi: 10.1172/jci.insight.88628.

Lymphocyte activation gene 3 and coronary artery disease

Affiliations

Lymphocyte activation gene 3 and coronary artery disease

Diana Golden et al. JCI Insight. .

Abstract

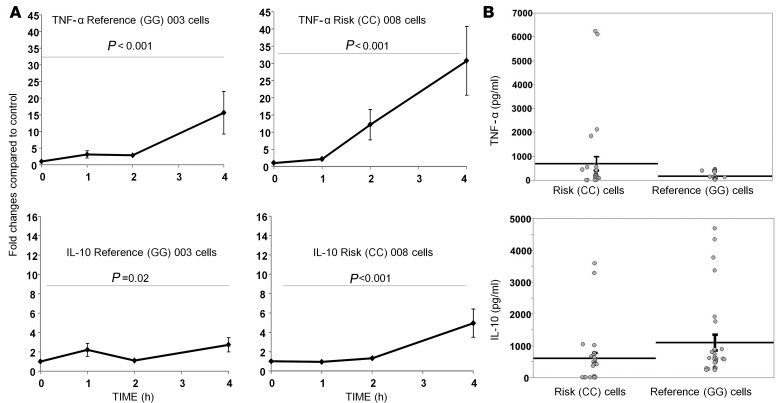
BACKGROUND: The lipoprotein scavenger receptor BI (SCARB1) rs10846744 noncoding variant is significantly associated with atherosclerotic disease independently of traditional cardiovascular risk factors. We identified a potentially novel connection between rs10846744, the immune checkpoint inhibitor lymphocyte activation gene 3 (LAG3), and atherosclerosis. METHODS: In vitro approaches included flow cytometry, lipid raft isolation, phosphosignaling, cytokine measurements, and overexpressing and silencing LAG3 protein. Fasting plasma LAG3 protein was measured in hyperalphalipoproteinemic (HALP) and Multi-Ethnic Study of Atherosclerosis (MESA) participants. RESULTS: In comparison with rs10846744 reference (GG homozygous) cells, LAG3 protein levels by flow cytometry (P < 0.001), in lipid rafts stimulated and unstimulated (P = 0.03), and phosphosignaling downstream of B cell receptor engagement of CD79A (P = 0.04), CD19 (P = 0.04), and LYN (P = 0.001) were lower in rs10846744 risk (CC homozygous) cells. Overexpressing LAG3 protein in risk cells and silencing LAG3 in reference cells confirmed its importance in phosphosignaling. Secretion of TNF-α was higher (P = 0.04) and IL-10 was lower (P = 0.04) in risk cells. Plasma LAG3 levels were lower in HALP carriers of the CC allele (P < 0.0001) and by race (P = 0.004). In MESA, race (P = 0.0005), age (P = 0.003), lipid medications (P = 0.03), smoking history (P < 0.0001), and rs10846744 genotype (P = 0.002) were independent predictors of plasma LAG3. In multivariable regression models, plasma LAG3 was significantly associated with HDL-cholesterol (HDL-C) (P = 0.007), plasma IL-10 (P < 0.0001), and provided additional predictive value above the Framingham risk score (P = 0.04). In MESA, when stratified by high HDL-C, plasma LAG3 was associated with coronary heart disease (CHD) (odds ratio 1.45, P = 0.004). CONCLUSION: Plasma LAG3 is a potentially novel independent predictor of HDL-C levels and CHD risk. FUNDING: This work was supported by an NIH RO1 grant (HL075646), the endowed Linda and David Roth Chair for Cardiovascular Research, and the Harold S. Geneen Charitable Trust Coronary Heart Disease Research award to Annabelle Rodriguez. MESA is conducted and supported by the National Heart, Lung, and Blood Institute (NHLBI) in collaboration with MESA investigators. Support for MESA is provided by contracts HHSN268201500003I, N01-HC-95159, N01-HC-95160, N01-HC-95161, N01-HC-95162, N01-HC-95163, N01-HC-95164, N01-HC-95165, N01-HC-95166, N01-HC-95167, N01-HC-95168, N01-HC-95169, UL1-TR-001079, UL1-TR-000040, and DK063491. Cardiometabochip genotyping data for the MESA samples was supported in part by grants and contracts R01HL98077, N02-HL-64278, HL071205, UL1TR000124, DK063491, RD831697, and P50 ES015915.


Figures

Figure 1
Figure 1. Overall study design for the HALP and MESA cohorts.
Figure 2
Figure 2. Differential expression of LAG3 protein and cytokine effects in SCARB1 rs10846744 reference (GG) and risk (CC) cells.
EBV-transformed B lymphocytes homozygous for the reference (GG) or risk (CC) allele were incubated under basal or stimulated cocktail (500 ng/ml PMA, 250 ng/ml ionomycin, and 100 U/ml IL-4) conditions for 0–4 hours and stained with isotype control or anti–human LAG3-PE monoclonal antibody for measurement of percentage cell surface LAG3 protein, and then fixed for flow cytometry. (A) Reference cells (003 cell line) under basal and stimulated conditions were stained with isotype control or LAG3 antibodies; the data are representative of 1 of 3 independent experiments. (B) Risk cells (008 cell line) under basal and stimulated conditions were stained with isotype control or anti–human LAG3-PE monoclonal antibody; the data are representative of 1 of 3 independent experiments. (C) Graphic analysis of percentage cell surface protein expression of LAG3+ cells as measured by flow cytometry. Top left panel represents pooled data (mean ± SEM) of 3 independent experiments from the reference (GG-003) cells, each experiment performed with triplicate samples (n = 9, P < 0.001 compared with baseline). Top right panel represents pooled data (mean ± SEM) from 3 independent reference cell lines (n = 18, P < 0.001 compared with baseline). Bottom left presents pooled data (mean ± SEM) of 3 independent experiments from the risk (CC-008) cells, each experiment performed with triplicate samples (n = 9, P = 0.06). Bottom right panel represents pooled data (mean ± SEM) from all the risk cell lines (n = 15, P = 0.04). (D) Changes in LAG3 protein levels in the media over time following cocktail (PMA/ionomycin+IL-4) stimulation in reference-expressing and risk-expressing cells. Top panel represents pooled data (mean ± SEM) of 3 independent experiments from the reference (GG-003) cell line, each experiment performed with duplicate samples (n = 6, *P = 0.03 compared with baseline), and from pooled data (mean ± SEM) of 3 independent experiments from the risk (CC-008) cell line, each experiment performed with duplicate samples (n = 6, P ≥ 0.05, not significant). Bottom panel represents pooled data (mean ± SEM) from all the reference cell lines (n = 12, P ≥ 0.05, not significant) and pooled data (mean ± SEM) from all the risk cell lines (n = 10, P ≥ 0.05, not significant). Quadratic polynomial statistical analyses were performed to test significance.
Figure 3
Figure 3. Changes in secreted cytokine (TNF-α and IL-10) levels in the media over time following activation in reference-expressing (GG-003) and risk-expressing (CC-008) cells.
(A) Top left panel represents TNF-α pooled data (mean ± SEM) of 3 independent experiments from the reference cell line, each experiment performed with duplicate samples (n = 6, P < 0.001 compared with baseline), while top right panel represents TNF-α pooled data (mean ± SEM) of 3 independent experiments from the risk cell line, each experiment performed with duplicate samples (n = 6, P < 0.001 compared with baseline). Bottom left panel represents IL-10 pooled data (mean ± SEM) from the reference cell line, each experiment performed with duplicate samples (n = 6, P = 0.02 compared with baseline), while bottom right panel represents IL-10 pooled data (mean ± SEM) of 3 independent experiments from the risk cell line, each experiment performed with duplicate samples (n = 6, P < 0.001). (B) Secretion of TNF-α and IL-10 from reference-expressing and risk-expressing cells. The results shown are mean ± SEM of data from pooling all time points from each individual group. TNF-α levels were significantly higher in risk cells as compared with reference cells (P = 0.04). IL-10 levels were significantly higher in reference cells as compared with risk cells (P = 0.04). Quadratic polynomial regression models were used in analyses in (A); 2-sided Student’s t test was used for 2-sample analysis in B. A P value less than 0.05 was considered significant.
Figure 4
Figure 4. LAG3 protein is crucial in B cell receptor (BCR) signaling.
Protein was isolated from EBV-transformed B cells expressing the reference (GG) or risk (CC) allele under basal or cocktail-stimulated (PMA/ionomycin+IL-4) conditions for 2 hours. (A) Ramos cell line as control B cells, reference (GG-003) cell line or risk (CC-008) cell line. As compared with basal conditions, p-CD79A (P = 0.04), p-CD19 (P = 0.04), p-SYK (P = 0.005), p-LYN (P = 0.001), p-PLCγ2 (P = 0.004) and p-PKCβ (P = 0.003) were increased in stimulated reference cells. Similar experiments were performed for additional cell lines derived from subjects expressing the reference or risk allele for a total of 6 independent cell lines (n = 3 for the reference cells and n = 3 for the risk-expressing cells) (Supplemental Figure 4). (B) The effect of overexpression of lentiviral LAG3-GFP or short-hairpin, shRNA-LAG3 silencing on BCR phosphosignaling in unstimulated cells. Lanes: 1, mock transduction in risk cells; 2, transduction of lentiviral LAG3-GFP in risk cells; 3, transduction of lentiviral LAG3-GFP in reference cells; 4, mock transduction in reference cells; 5, transduction of scrambled shRNA in reference cells; and 6, transduction of shRNA-LAG3 in reference cells. As compared with cells transduced with the mock vector, p-LYN (P = 0.04) and p-PKCβ (P = 0.03) were increased in risk cells overexpressing LAG3 protein (lane 2), while p-LYN (P = 0.04) and p-PKCβ (P = 0.01) were increased in reference cells overexpressing LAG3 protein (lane 3) as compared with cells expressing the mock vector. (C) The effect of overexpression of lentiviral LAG3-GFP or shRNA-LAG3 silencing on BCR phosphosignaling in stimulated cells. Lanes: 1, mock transduction in risk cells; 2, transduction of lentiviral LAG3-GFP in risk cells; 3, transduction of lentiviral LAG3-GFP in reference cells; 4, mock transduction in reference cells; 5, transduction of scrambled shRNA in reference cells; and 6, transduction of shRNA-LAG3 in reference cells. As compared with cells transduced with mock vector, p-LYN (P = 0.01) and p-PKCβ (P = 0.01) were increased in stimulated risk and reference cells overexpressing LAG3 protein (lanes 2 and 3, respectively). As compared with mock-transduced reference cells, LAG3 silencing was associated with reduced p-LYN (P = 0.002) and p-PKCβ (P = 0.009) (lane 6). In lanes 4 and 5, reference cells showed the expected increase in p-LYN and p-PKCβ following stimulation. The results were analyzed using a 2-sided Student’s t test; n = 3, P < 0.05 was considered significant.
Figure 5
Figure 5. Association of SCARB1 rs10846744 genotypes with plasma LAG3 (log-transformed) in the HALP cohort.
In the pooled analysis, homozygous carriers of the rs10846744 risk (CC) allele (n = 20) had significantly lower plasma LAG3 levels compared with heterozygous (n = 24) and homozygous carriers of the (G) allele (n = 102) (1-way ANOVA, P < 0.0001, n = 146).
Figure 6
Figure 6. Association of race/ethnicity with plasma LAG3 (log-transformed) in the HALP cohort.
African-Americans (n = 20) had significantly lower plasma LAG3 levels (log-transformed) compared with those of Mixed European Descent (n = 100), Hispanics (n = 6), and Asians (n = 7). One-way ANOVA, P=0.004, total n = 133.
Figure 7
Figure 7. Association of SCARB1 rs10846744 genotypes with plasma LAG3 (log-transformed) in MESA participants.
In the pooled analysis, homozygous carriers of the risk rs10846744 (CC) allele (n = 974) had significantly higher plasma LAG3 levels compared with heterozygous (n = 2,185) and homozygous reference (GG) allele carriers (n = 2,448). One-way ANOVA, P < 0.0001, total n = 5,607.
Figure 8
Figure 8. Association of race/ethnicity with plasma LAG3 (log-transformed) in MESA participants.
Chinese-Americans (n = 633) and African-Americans (n = 1,428) had significantly higher plasma LAG3 levels compared with people of Mixed European Descent (n = 2,282) and Hispanics (n = 1,275) (P < 0.0001) and were not significantly different from each other. There were no significant differences in plasma LAG3 levels between patients of Mixed European Descent and Hispanics. One-way ANOVA, P < 0.0001, total n = 561.

Similar articles

Cited by

References

    1. Acton S, Rigotti A, Landschulz KT, Xu S, Hobbs HH, Krieger M. Identification of scavenger receptor SR-BI as a high density lipoprotein receptor. Science. 1996;271(5248):518–520. doi: 10.1126/science.271.5248.518. - DOI - PubMed
    1. Rigotti A, Trigatti BL, Penman M, Rayburn H, Herz J, Krieger M. A targeted mutation in the murine gene encoding the high density lipoprotein (HDL) receptor scavenger receptor class B type I reveals its key role in HDL metabolism. Proc Natl Acad Sci U S A. 1997;94(23):12610–12615. doi: 10.1073/pnas.94.23.12610. - DOI - PMC - PubMed
    1. Trigatti B, et al. Influence of the high density lipoprotein receptor SR-BI on reproductive and cardiovascular pathophysiology. Proc Natl Acad Sci U S A. 1999;96(16):9322–9327. doi: 10.1073/pnas.96.16.9322. - DOI - PMC - PubMed
    1. West M, et al. Scavenger receptor class B type I protein as an independent predictor of high-density lipoprotein cholesterol levels in subjects with hyperalphalipoproteinemia. J Clin Endocrinol Metab. 2009;94(4):1451–1457. doi: 10.1210/jc.2008-1223. - DOI - PMC - PubMed
    1. Naj AC, et al. Association of scavenger receptor class B type I polymorphisms with subclinical atherosclerosis: the Multi-Ethnic Study of Atherosclerosis. Circ Cardiovasc Genet. 2010;3(1):47–52. doi: 10.1161/CIRCGENETICS.109.903195. - DOI - PMC - PubMed

Publication types