. 2016 Oct 20;1(17):e89704.
doi: 10.1172/jci.insight.89704.

Acquired resistance to innate immune clearance promotes Klebsiella pneumoniae ST258 pulmonary infection

Affiliations

Acquired resistance to innate immune clearance promotes Klebsiella pneumoniae ST258 pulmonary infection

Danielle Ahn et al. JCI Insight. .

Abstract

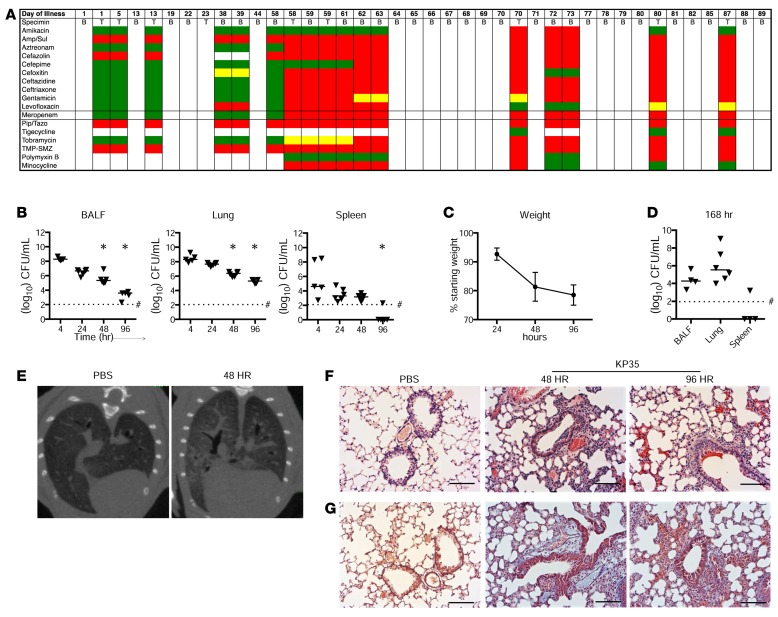
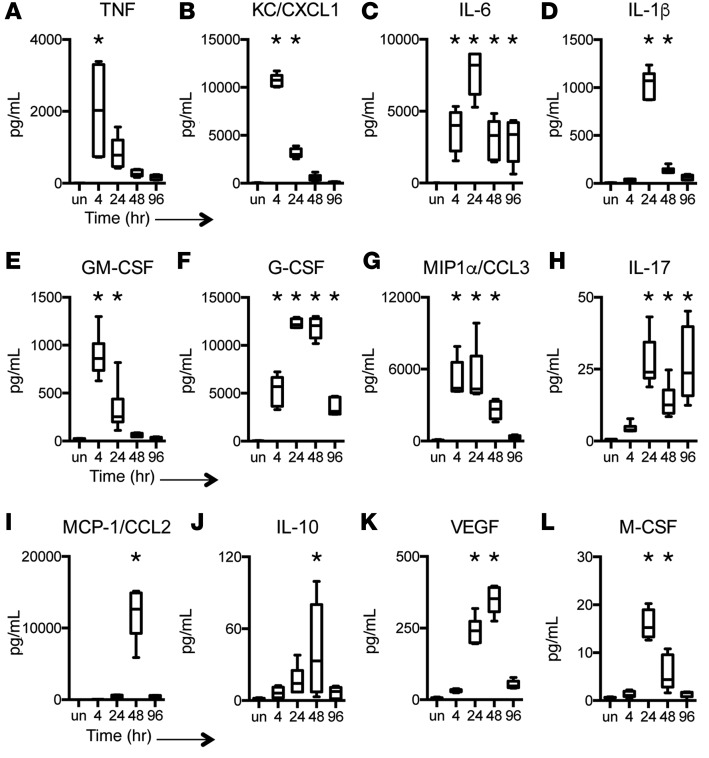
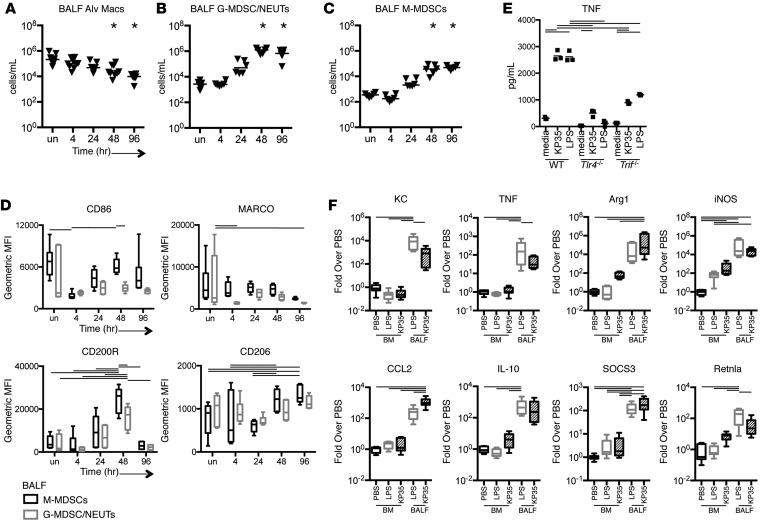
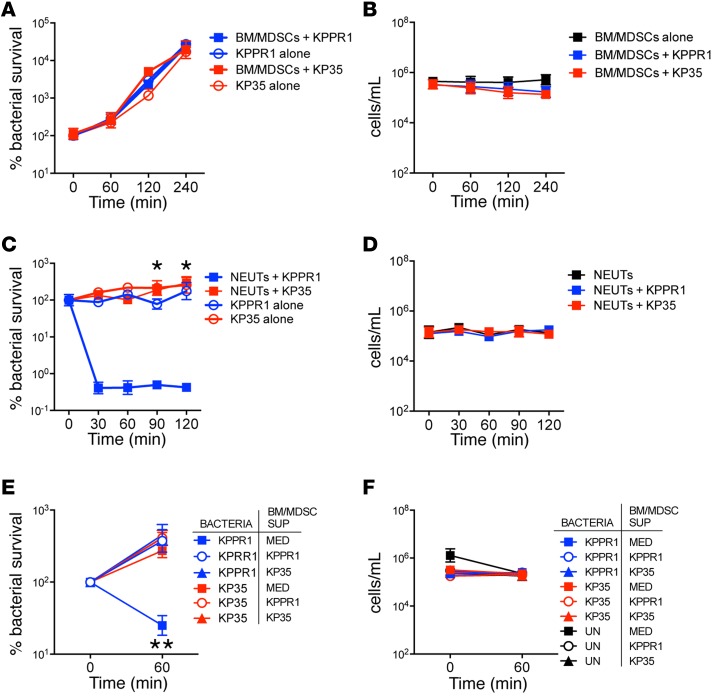
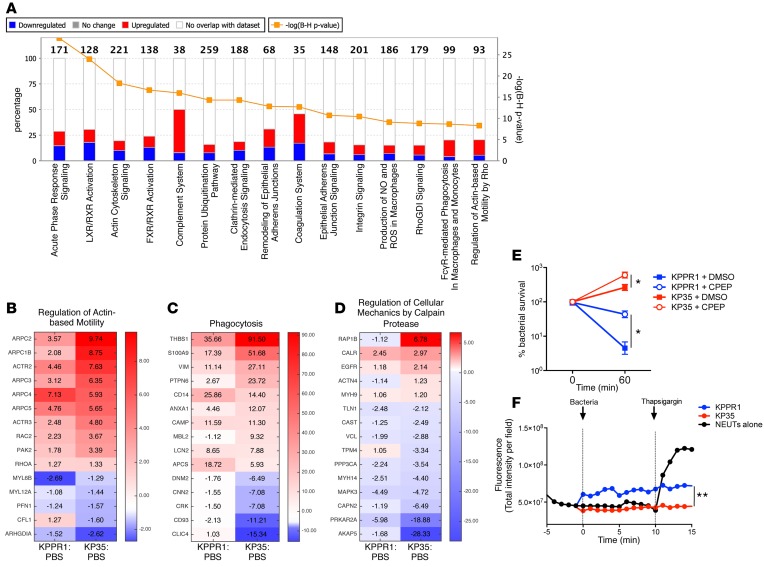
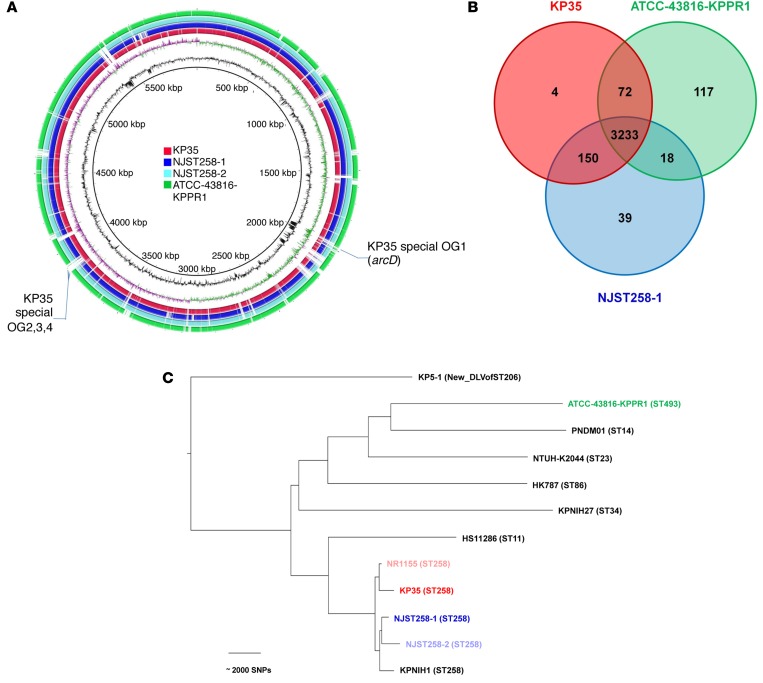
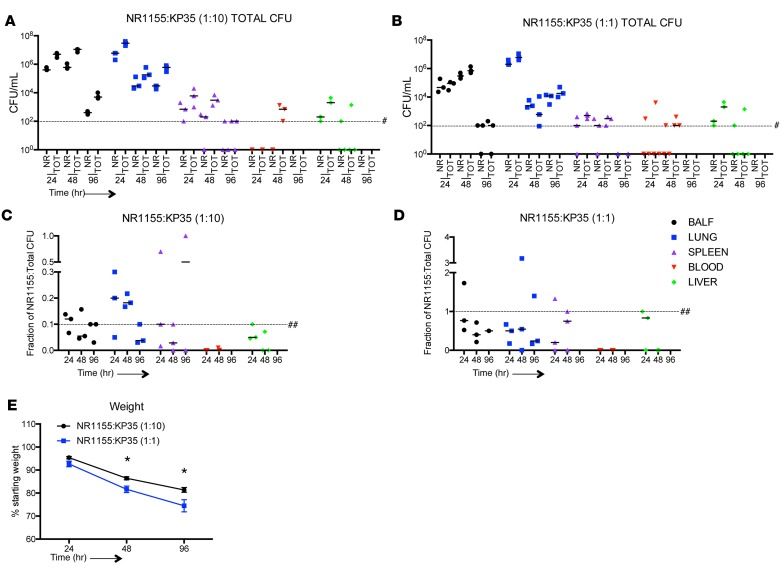
Adaptive changes in the genome of a locally predominant clinical isolate of the multidrug-resistant Klebsiella pneumoniae ST258 (KP35) were identified and help to explain the selection of this strain as a successful pulmonary pathogen. The acquisition of 4 new ortholog groups, including an arginine transporter, enabled KP35 to outcompete related ST258 strains lacking these genes. KP35 infection elicited a monocytic response, dominated by Ly6Chi monocytic myeloid-derived suppressor cells that lacked phagocytic capabilities, expressed IL-10, arginase, and antiinflammatory surface markers. In comparison with other K. pneumoniae strains, KP35 induced global changes in the phagocytic response identified with proteomics, including evasion of Ca2+ and calpain activation necessary for phagocytic killing, confirmed in functional studies with neutrophils. This comprehensive analysis of an ST258 K. pneumoniae isolate reveals ongoing genetic adaptation to host microenvironments and innate immune clearance mechanisms that complements its repertoire of antimicrobial resistance genes and facilitates persistence in the lung.


Figures

Figure 1
Figure 1. Kinetics of KP35 infection and host response.
(A) Antimicrobial susceptibility of the K. pneumoniae strains isolated from the airway and bloodstream of a patient over a 3-month hospitalization. B, blood; T, tracheal aspirate. Red = resistant, Yellow = intermediate, or Green = sensitive minimum inhibitory concentration for the given isolate for the corresponding antibiotic. (B) Kinetics of KP35 clearance from bronchoalveolar lavage fluid (BALF), lung homogenate, and spleen following intranasal inoculation of 1 × 10⁸ to 2 × 10⁸ CFU in WT mice over the course of a 4-day infection. # = the lower limit of detection. Horizontal lines represent median values and each data point represents an individual mouse. n = 6 per time point. All data were compiled from 2 independent experiments. n = 5–6 per time point. *P < 0.05, compared with CFU at 4 hours of infection, Kruskal-Wallis test, 1-way ANOVA, Dunn’s correction for multiple comparisons. (C) Weight loss over the course of infection, data points represent mean values ± SEM. n = 5–6 per time point. (D) Bacterial load enumerated from selected compartments after 7 days of infection. # = the lower limit of detection. Horizontal lines represent median values and each data point represents an individual mouse. n = 4–6 per compartment. (E) CT imaging demonstrates diffuse bronchopneumonia 48 hours following KP35 infection. Representative axial images obtained with the Quantum FX CT Scanner in 3-μm slices are shown. (F) Histopathology of KP35 pneumonia demonstrating peribronchial consolidation and cellular infiltrates in H&E-stained sections of lung, PBS control, and KP35 infection at 48 and 96 hours. (G) Trichrome staining of KP35-infected lung sections demonstrating patchy disruption of the alveolar architecture and discrete areas of collagen deposition. Scale bars (F and G): 100 μm.
Figure 2
Figure 2. Biphasic cytokine response to KP35 infection.
Selected cytokine and chemokine content of bronchoalveolar lavage fluid of WT mice following intranasal inoculation of 1 × 10⁸ to 2 × 10⁸ CFU in WT mice over the course of a 4-day infection was quantified by multiplex assay. *P < 0.05, compared with uninfected (un) control, Kruskal-Wallis test, 1-way ANOVA, Dunn’s correction for multiple comparisons. All data were compiled from 2 independent experiments, n = 6 per time point. For data presented as box-and-whiskers plots, horizontal lines indicate the median, boxes indicate 25th to 75th percentiles, and whiskers indicate minimum and maximum values of the data set.
Figure 3
Figure 3. Recruitment of monocytes in response to KP35.
(AC) Cellular response to infection in bronchoalveolar lavage fluid (BALF) determined by flow cytometry — alveolar macrophages (Alv Macs) (CD45+SiglecF+CDll11blo-mid), granulocytic myeloid-derived suppressor cells/neutrophils (G-MDSCs/NEUTs) (CD45+CD11b+MHCIIloLy6ChiLy6Ghi), and monocytic myeloid-derived suppressor cells (M-MDSCs) (CD45+CD11b+MHCIIloLy6ChiLy6Glo). Horizontal lines represent median values and each data point represents an individual mouse. All data were compiled from 2 independent experiments, n = 6. *P < 0.05, compared with uninfected (un) control, Kruskal-Wallis test, 1-way ANOVA, Dunn’s correction for multiple comparisons. (D) Changes in surface markers associated with M-MDSCs and G-MDSCs/NEUTs determined by geometric mean fluorescence intensity (MFI), n = 6. For box-and-whiskers plots, horizontal lines indicate the median, boxes indicate 25th to 75th percentiles, and whiskers indicate minimum and maximum values of the data set. (E) Levels of TNF measured by ELISA from supernatants from immortalized bone marrow–derived macrophages (BMDMs) (WT, Tlr4–/–, or Trif–/–) incubated with KP35 or E. coli LPS (10 μg/ml) as a positive control for 4 hours. Representative graph of 2 independent experiments, n = 3 per condition. (F) Cytokine and chemokine production by Ly6C+ cells isolated from WT mice following exposure to KP35 (1 × 10⁸ to 2 × 10⁸ CFU) or E. coli LPS (50 μg), measured by qRT-PCR compared with PBS control. n = 7–9. For BD, columns represent mean values ± SEM, horizontal bars represent P < 0.05 by 1- or 2-way ANOVA followed by Bonferroni’s or Dunn’s correction for multiple comparisons.
Figure 4
Figure 4. Resistance of KP35 to myeloid-derived suppressor cell (MDSC) and neutrophil killing.
Bacterial survival of KP35 (red) and KPPR1 (blue) (MOI of 1) in the presence of: (A) MDSCs derived from bone marrow monocytes (BM/MDSCs), polarized ex vivo (n = 6) with (B) MDSC survival over the course of infection, and (C) freshly isolated neutrophils (NEUTs) from BM (n = 4) with (D) neutrophil survival. *P < 0.05 compared with NEUTs with KP35. (E and F) Inhibition of neutrophil killing of KPPR1 or KP35 (MOI of 1) by supernatant (SUP) harvested from BM/MDSCs stimulated with KP35 or KPPR1 (MOI of 10) or a media control (MED), n = 9. **P < 0.05 compared with KPPR1 infection with KPPR1 or KP35 infected SUP. There was no change in cell viability over time (B, D, and F). Graphs are compiled from 2 (AD) or 3 independent experiments (E and F). For all graphs, each data point is the mean value ± SEM. *P < 0.05 by 2-way ANOVA. For all analyses, Bonferroni’s correction for multiple comparisons was performed.
Figure 5
Figure 5. Global changes in host signaling induced by KP35 and KPPR1.
(A) The major canonical pathways significantly affected by KP35 are shown in order of statistical significance. Spectral counts for the 1,638 proteins in the pooled bronchoalveolar lavage fluid (n = 3) were uploaded into ingenuity pathway analysis software. Numbers above the columns are the number of proteins within each group, with colored bars representing the proportion of up- and downregulated genes with KP35 infection as compared with PBS control. Subgroup analysis reflects the differential abundance of specific proteins in KPPR1 and KP35 infection, normalized to PBS controls. This analysis identified (B) actin cytoskeletal remodeling, (C) phagocytosis, and (D) Ca2+/calpain signaling pathways as differentially affected by KP35 as compared with KPPR1. (E) Functional confirmation of the importance of Ca2+ fluxes in phagocytic killing. Percentage of KPPR1 (blue) and KP35 (red) (MOI of 1) killing by neutrophils in the presence of calpeptin (CPEP) compared with DMSO control. *P < 0.05, Mann-Whitney test, n = 8. (F) Differential activation of Ca2+ fluxes by KP35 and KPPR1. Ca2+ fluxes were measured in murine neutrophils (NEUTs) loaded with AM/Fluo-4 prior to stimulation with KP35 and KPPR1 (MOI of 100) or media alone followed by thapsigargin (1 μM) as a positive control. Total field fluorescence was measured at each time point using ImageJ. **P < 0.05, 2-way ANOVA, Bonferroni’s correction for multiple comparisons. Data were compiled from E or are representative (F) of at least 3 independent experiments.
Figure 6
Figure 6. Comparative genomics of KP35, NR1155, published ST258 strains, and the KPPR1 reference strain.
(A) Whole-genome alignment of the 4 K. pneumoniae genomes. The de novo–assembled KP35 draft genome and 2 other ST258 reference genomes (NJST258-1 and NJST258-2), aligned to the published ATCC-43816-KPPR1 genome. From the inner to the outer circles: scale bar, GC content, GC skew, KP35, NJST258-1, NJST258-2, ATCC-43816-KPPR1. The location of the KP35 special orthologous groups (OGs), in particular ArcD, were marked. (B) Venn diagram of the proteome OGs, KP35, ATCC-43816-KPPR1, and NJST258-1 showing the number of common and distinct OGs between KP35, ATCC-43816-KPPR1, and NJST258-1. (C) RaxML phylogenetic tree representing genetic origins of ATCC-43816-KPPR1, NR1155, KP35, and multiple clinical isolates of ST258. The tree was based on 79,458 concatenated core genome SNPs of the KP35 and 11 other published K. pneumoniae genomes. The multilocus sequence type of each isolate follows in parentheses. Bar represents ~2,000 SNPs.
Figure 7
Figure 7. KP35 enjoys a fitness advantage over NR1155.
(A and B) A competitive index experiment was performed with NR1155, a closely related isolate to KP35, missing the 4 KP35 special ortholog groups including arcD but harboring the tetracycline resistance genes tetA and tetR. Mice were inoculated intranasally with 108 CFU at a 1:10 ratio of NR1155/KP35 or 107 CFU at a 1:1 ratio and bacterial CFU were quantified. (C and D) Ratio of the tetracycline-resistant isolate NR1155 to the total quantified bacterial load was determined by serial dilution. ## = baseline inoculum. Total CFU recovered from different tissues. NR, NR1155 grown on tetracycline-impregnated LB plates; TOT, total CFU enumerated on LB-alone plates. # = the lower limit of detection. Each data point represents a mouse and the horizontal line is the median. The median proportion of NR1155 in the total inoculum measured at each time point was significantly lower than the baseline (or initial proportion) in all tissues analyzed for both inoculum ratios. P < 0.01, using chi-squared test for trend. (E) Weight loss of the mice over the course of a 4-day infection. *P < 0.05, 2-way ANOVA with Bonferroni’s correction for multiple comparisons

Similar articles

Cited by

References

    1. Gomez-Simmonds A, et al. Population structure of Klebsiella pneumoniae causing bloodstream infections at a New York City tertiary care hospital: diversification of multidrug-resistant isolates. J Clin Microbiol. 2015;53(7):2060–2067. doi: 10.1128/JCM.03455-14. - DOI - PMC - PubMed
    1. Tumbarello M, et al. Infections caused by KPC-producing Klebsiella pneumoniae: differences in therapy and mortality in a multicentre study. J Antimicrob Chemother. 2015;70(7):2133–2143. - PubMed
    1. Lee GC, Burgess DS. Treatment of Klebsiella pneumoniae carbapenemase (KPC) infections: a review of published case series and case reports. Ann Clin Microbiol Antimicrob. 2012;11:e89704. - PMC - PubMed
    1. Borer A, et al. Attributable mortality rate for carbapenem-resistant Klebsiella pneumoniae bacteremia. Infect Control Hosp Epidemiol. 2009;30(10):972–976. doi: 10.1086/605922. - DOI - PubMed
    1. Kitchel B, et al. Molecular epidemiology of KPC-producing Klebsiella pneumoniae isolates in the United States: clonal expansion of multilocus sequence type 258. Antimicrob Agents Chemother. 2009;53(8):3365–3370. doi: 10.1128/AAC.00126-09. - DOI - PMC - PubMed

Publication types