. 2017 Apr;42(2):107-121.
doi: 10.1007/s10827-016-0630-8. Epub 2016 Oct 24.

Analysis of the dynamics of temporal relationships of neural activities using optical imaging data

Affiliations

Analysis of the dynamics of temporal relationships of neural activities using optical imaging data

Jannetta S Steyn et al. J Comput Neurosci. 2017 Apr.

Abstract

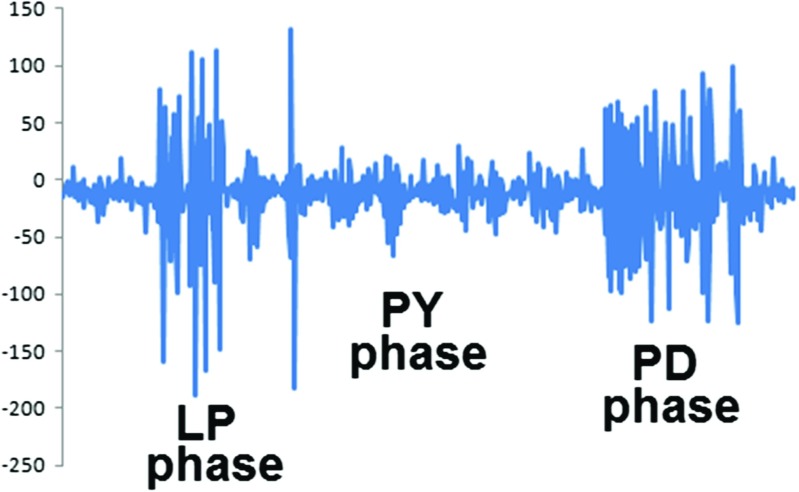
The temporal relationship between the activities of neurons in biological neural systems is critically important for the correct delivery of the functionality of these systems. Fine measurement of temporal relationships of neural activities using micro-electrodes is possible but this approach is very limited due to spatial constraints in the context of physiologically valid settings of neural systems. Optical imaging with voltage-sensitive dyes or calcium dyes can provide data about the activity patterns of many neurons in physiologically valid settings, but the data is relatively noisy. Here we propose a numerical methodology for the analysis of optical neuro-imaging data that allows robust analysis of the dynamics of temporal relationships of neural activities. We provide a detailed description of the methodology and we also assess its robustness. The proposed methodology is applied to analyse the relationship between the activity patterns of PY neurons in the crab stomatogastric ganglion. We show for the first time in a physiologically valid setting that as expected on the basis of earlier results of single neuron recordings exposure to dopamine de-synchronises the activity of these neurons. We also discuss the wider implications and application of the proposed methodology.

Keywords: Computational analysis; Neuron-scale imaging; Stomatogastric ganglion; Synchronisation; Voltage sensitive dye.


Conflict of interest statement

The authors declare that they have no conflict of interest.

Figures

Fig. 1
Fig. 1
Intracellular recording of a neuron from the crab stomatogastric ganglion. The spiking of the neurons happen during the depolarisation plateaus. The horizontal axis is time, the vertical axis is voltage in arbitrary units
Fig. 2
Fig. 2
Typical activity profile of a neuron. The spiking happens during the activity plateau, which is preceded by the ramp-up phase and followed by the ramp-down phase. The vertical axis shows the membrane potential of the neuron
Fig. 3
Fig. 3
a Maximum slope points (as dots) calculated for simulated neural activity having plateau potential difference that is much larger than the potential difference corresponding to spiking activity; b The calculated local slope values for the data shown in a); c Maximum slope points (as dots) calculated for simulated neural activity having plateau potential difference that is much smaller than the potential difference corresponding to spiking activity; d The calculated local slope values for the data shown in c). The horizontal lines in d) indicate the range of local slope values that are considered for maximum slope point identification. The horizontal axis is always time, the vertical axis represents the voltage in a) and c) in arbitrary units and the local slope value in b) and d)
Fig. 4
Fig. 4
a Simulated activity of a neuron. The calculated maximum slopes are shown as red dots and the calculated minimum slopes are shown as green dots. The beginning and end points of activity plateaus are shown with yellow squares and purple diamonds respectively; b The thin green lines indicate the value band that is considered to correspond to the activity plateau following the maximum slope point. The horizontal axis is time in both cases, while the vertical axis represents voltage in (a) in arbitrary units and the calculated local slope value in (b)
Fig. 5
Fig. 5
Typical arrangement of neurons in the crab STG. The neuropil is on the left side of the image, the neurons (circular shaped surrounds) are arranged in a semi-circle on the right. The scale bar is 100 microns
Fig. 6
Fig. 6
An example of the pyloric rhythm recorded on the lvn. Horizontal axis is time, vertical axis in voltage in arbitrary units
Fig. 7
Fig. 7
a VSD recording of a PY neuron together with the minimum (yellow circle) and maximum slope (red diamond) points and beginning (blue triangle) and end (black square) points of the activity plateau determined from the data; b The calculated local slope values, the green horizontal lines indicate the band of values considered to correspond to the activity plateau following the maximum local slope point. The horizontal axis is time in both cases and the vertical axis is voltage in arbitrary units in a) and the local slope value in b)
Fig. 8
Fig. 8
The complete workflow of the data analysis presented in Section 4
Fig. 9
Fig. 9
The results of the dopamine experiments. The calculated standard deviation values are shown on the vertical axes. Each pair of bars represents a comparison of a pair of PY neurons. Control indicates standard deviation values calculated before the exposure to dopamine, DA indicates standard deviation values calculated following the exposure to dopamine. The difference is considered statistically significant if the p-value is less than 0.05. Asterisks indicate pairs where the difference is statistically significant

Similar articles

Cited by

References

    1. Abeles M, Hayon G, Lehmann D. Modeling compositionality by dynamic binding of synfire chains. Journal of computational neuroscience. 2004;17(2):179–201. doi: 10.1023/B:JCNS.0000037682.18051.5f. - DOI - PubMed
    1. Ahrens MB, Li JM, Orger MB, Robson DN, Schier AF, Engert F, Portugues R. Brain-wide neuronal dynamics during motor adaptation in zebrafish. Nature. 2012;485(7399):471–477. - PMC - PubMed
    1. Axmacher N, Mormann F, Fernández G, Elger CE, Fell J. Memory Formation by neuronal synchronization. Brain Research Reviews. 2006;52(1):170–182. doi: 10.1016/j.brainresrev.2006.01.007. - DOI - PubMed
    1. Ayali A, Johnson BR, Harris-Warrick RM. Dopamine modulates graded and Spike-Evoked synaptic inhibition independently at single synapses in pyloric network of lobster. Journal of Neurophysiology. 1998;79(4):2063–2069. - PubMed
    1. Briggman KL, Kristan WB, Gonzalez JE, Kleinfeld D, Tsien RY. Membrane potential imaging in the nervous system. In: Canepari M, Zecevic D, editors. Membrane potential imaging in the nervous system. Membrane: Springer; 2010.

Substances

LinkOut - more resources