. 2016 Oct 25:7:13129.
doi: 10.1038/ncomms13129.

25-hydroxycholesterol contributes to cerebral inflammation of X-linked adrenoleukodystrophy through activation of the NLRP3 inflammasome

Affiliations

25-hydroxycholesterol contributes to cerebral inflammation of X-linked adrenoleukodystrophy through activation of the NLRP3 inflammasome

Jiho Jang et al. Nat Commun. .

Abstract

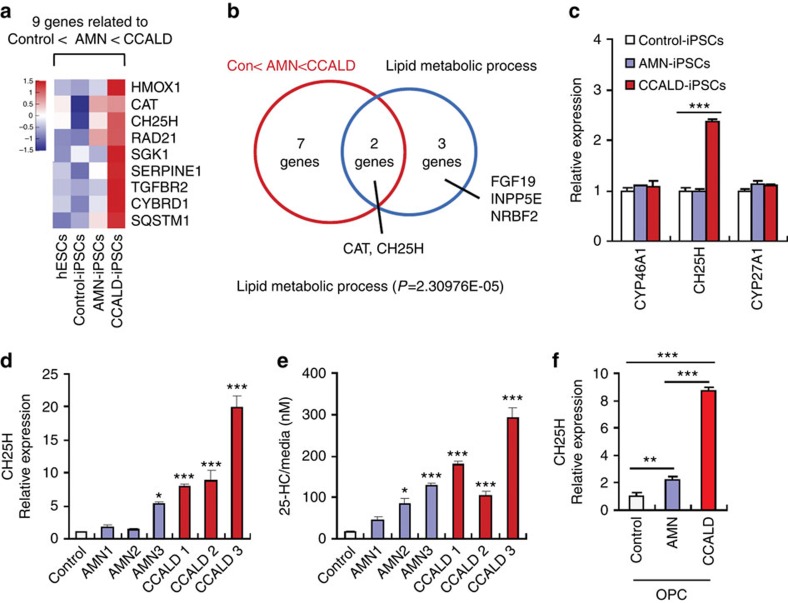
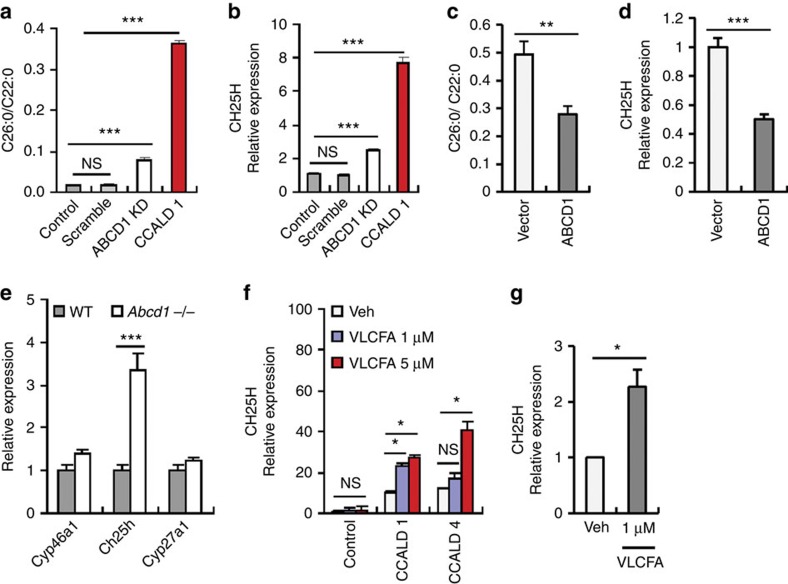
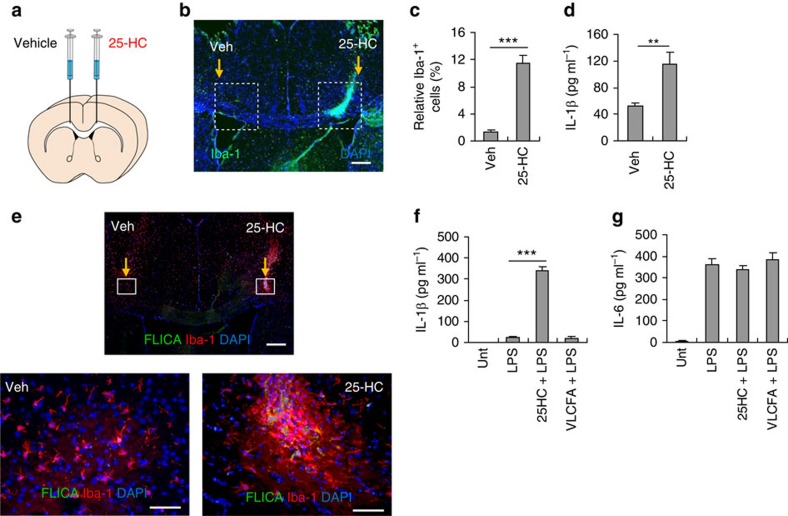
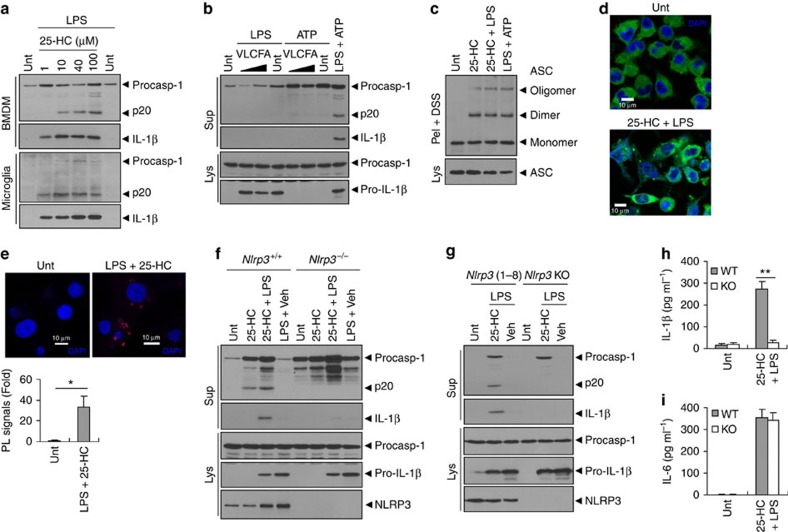
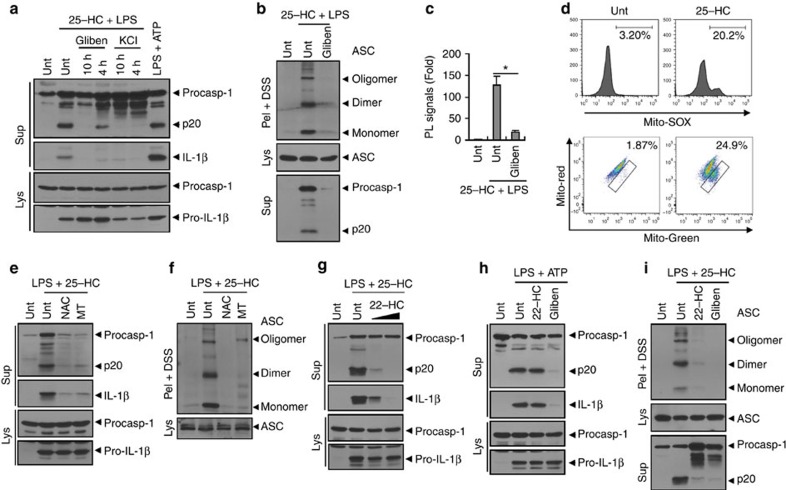
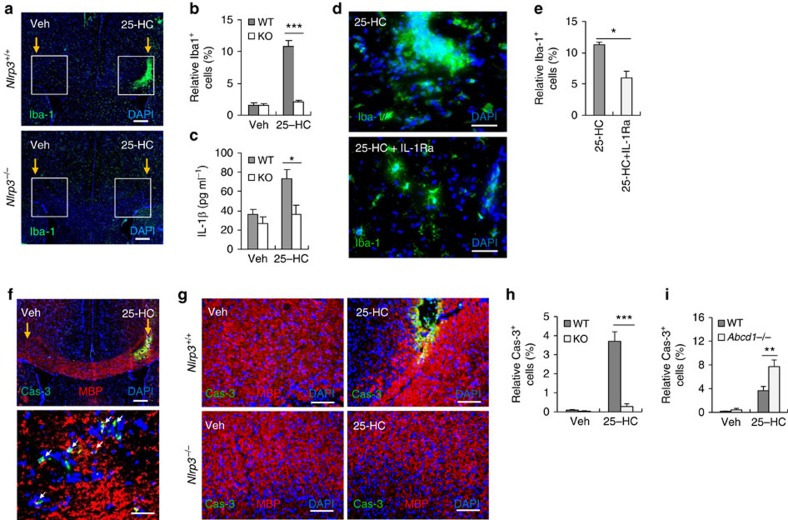
X-linked adrenoleukodystrophy (X-ALD), caused by an ABCD1 mutation, is a progressive neurodegenerative disorder associated with the accumulation of very long-chain fatty acids (VLCFA). Cerebral inflammatory demyelination is the major feature of childhood cerebral ALD (CCALD), the most severe form of ALD, but its underlying mechanism remains poorly understood. Here, we identify the aberrant production of cholesterol 25-hydroxylase (CH25H) and 25-hydroxycholesterol (25-HC) in the cellular context of CCALD based on the analysis of ALD patient-derived induced pluripotent stem cells and ex vivo fibroblasts. Intriguingly, 25-HC, but not VLCFA, promotes robust NLRP3 inflammasome assembly and activation via potassium efflux-, mitochondrial reactive oxygen species (ROS)- and liver X receptor (LXR)-mediated pathways. Furthermore, stereotaxic injection of 25-HC into the corpus callosum of mouse brains induces microglial recruitment, interleukin-1β production, and oligodendrocyte cell death in an NLRP3 inflammasome-dependent manner. Collectively, our results indicate that 25-HC mediates the neuroinflammation of X-ALD via activation of the NLRP3 inflammasome.


Figures

Figure 1
Figure 1. CH25H is upregulated in CCALD patient-derived cells.
(a) Candidate genes significantly up- or downregulated (fold-change cutoff ≥2 and P<0.05) were selected based on the microarray analysis of human ESCs, control-, AMN- and CCALD-iPSCs. Heat map of nine selected genes showing the expression patterns correlated with disease severity via microarray analysis. (b) Venn diagram of overlapping genes between nine genes related to disease severity and five genes (among 70 genes) related to lipid metabolism. Catalase (CAT) and CH25H belong to both categories. (c) Relative mRNA expression of three cholesterol-hydroxylating enzymes in the control- and AMN- or CCALD-iPSCs measured by quantitative real-time PCR analysis. (n=6) (d,e) Levels of CH25H mRNA in the cell lysates (d) and of 25-HC in the culture supernatants (e) of control- (human dermal fibroblast), 3 AMN- and 3 CCALD-fibroblasts. (d, n=6; e, n=4) (f) Relative mRNA expression of CH25H in the control- or X-ALD-iPSC-derived oligodendrocyte precursor cells (AMN- or CCALD-OPCs). (n=6) For all panels, *P<0.05, **P<0.01 and ***P<0.001.
Figure 2
Figure 2. ABCD1 regulates the induction of CH25H expression in a VLCFA-dependent manner.
(a,b) Cellular levels of VLCFA (a) and mRNA levels of CH25H (b) in control fibroblasts untransfected or transfected with scrambled- or ABCD1-targeting siRNA (ABCD1 KD) and in CCALD1 fibroblasts. (n=6) (c,d) Cellular levels of VLCFA (c) and mRNA levels of CH25H (d) in CCALD1 fibroblasts infected with lentiviral particles expressing empty vector or ABCD1 gene. (n=5) (e) Relative mRNA expression of Cyp46a1, Ch25h and Cyp27a1 in the brain homogenates of WT or Abcd1-deficient mice. (n=6). (f,g) Relative mRNA levels of CH25H in control- or two CCALD-fibroblasts (f) and in CCALD-OPCs (g) treated with vehicle (0.05% DMSO in PBS) or VLCFA at indicated concentration for 3 h. (f, n=6; g, n=5) For all panels, *P<0.05, **P<0.01, and ***P<0.001. NS, not significant.
Figure 3
Figure 3. 25-HC induces microglial recruitment and IL-1β production.
(a) Illustration of stereotaxic injection of 25-HC (100 μM) or vehicle (0.1% ethanol in PBS) into the corpus callosum of mouse brain. (b) Representative immunofluorescence image of a coronal brain section stained with anti-Iba-1 antibody (green). DAPI represents the nuclear signal (blue). Scale bar, 200 μm. (c) Quantification of Iba-1-positive cells in the boxed areas of vehicle- or 25-HC-injected regions in b. (n=8) (d) Quantification of IL-1β in the brain homogenates of vehicle- or 25-HC-injected hemisphere. (n=11) (e) Representative immunofluorescence image of brain section co-stained with FLICA (green) and anti-Iba-1 antibody (red) after injection of vehicle or 25-HC. Magnified immunofluorescence images of the boxed areas in the upper panel are displayed in the lower panel: 25-HC-injected area (right) or vehicle-injected area (left). Scale bars, 200 μm (upper); or 50 μm (lower). (f,g) Quantification of IL-1β or IL-6 in the culture supernatants of mouse BMDMs untreated or treated with 25-HC (70 μM) or VLCFA (70 μM) for 10 h in the presence of LPS (0.25 μg ml−1, last 4 h) as indicated. (n=6). For all panels, **P<0.01 and ***P<0.001.
Figure 4
Figure 4. 25-HC promotes the assembly and activation of the NLRP3 inflammasome.
(a) Immunoblots of culture supernatants from mouse BMDMs and microglia untreated or treated with 25-HC (10 h) in the presence of LPS (last 4 h). (b) Immunoblots from BMDMs untreated or treated with VLCFA (40 or 100 μM, 10 h) in the presence of LPS (last 4 h) or ATP (2.5 mM, last 45 min), or primed with LPS (3 h), followed by ATP. (c) Immunoblots of DSS-crosslinked pellets (pel + DSS) or cellular lysates (Lys) from BMDMs untreated or treated with 25-HC in the presence of LPS, or treated with LPS, followed by ATP. (d) Confocal images of NLRP3-GFP-expressing macrophages untreated or treated with 25-HC (50 μM, 10 h) in the presence of LPS. DAPI represents the nuclear signal (blue). Scale bars, 10 μm. (e) Proximity-ligation (PL) assay of NLRP3 and ASC in BMDMs treated with 25-HC (50 μM, 10 h) in the presence of LPS. PL signals (red) represent the molecular association of NLRP3 and ASC. Data are shown as a representative image from five-independent samples (upper panel). DAPI represents the nuclear signal (blue). Scale bars, 10 μm. Relative intensity of PL signals (per DAPI signals) was determined and is displayed in the lower panel. (n=5) (f) Nlrp3+/+ or Nlrp3−/− BMDMs were treated with 25-HC (100 μM) or vehicle (0.1% ethanol in PBS) in the presence of LPS (last 4 h) as indicated, and analysed by immunoblot. (g) Nlrp3-expressing (1–8) or Nlrp3-deficient immortalized BMDMs were treated with 25-HC in the presence of LPS as indicated and analysed by immunoblot. (h,i) Quantification of IL-1β (h) or IL-6 (i) in supernatant fractions of Nlrp3+/+ (WT) or Nlrp3−/− (KO) microglial cells treated with 25-HC (50 μM) in the presence of LPS. (n=5) (b,c,f,g) Culture supernatants (Sup), cellular lysates (Lys) or DSS-crosslinked pellets (Pel + DSS) as indicated were analysed by immunoblot. For all panels, *P<0.05 and **P<0.01.
Figure 5
Figure 5. 25-HC activates the NLRP3 inflammasome signalling in a potassium efflux/mitochondrial ROS/LXR-dependent manner.
(a) Immunoblots of mouse BMDMs treated with 25-HC (50 μM, 10 h) and LPS (final 4 h) in the presence of glibenclamide (50 μM) or KCl (20 mM) for the indicated times, or treated with LPS, followed by ATP. (b) Immunoblots of BMDMs treated with 25-HC (50 μM, 10 h) and LPS (final 4 h) in the presence of glibenclamide (50 μM, 10 h). (c) PL assay of NLRP3 and ASC in microglia similarly treated as in b. Relative PL signals (per DAPI) are displayed. (n=5) *P<0.05 (d) Flow cytometric analysis of BMDMs treated with 25-HC (50 μM, 10 h) and LPS (final 3 h) after staining with MitoSOX (upper panel) or co-stained with MitoTracker Green and MitoTracker Deep Red (lower panel). (e,f) Immunoblots of BMDMs primed with LPS (3 h), followed by treatments with 25-HC (80 μM) in the presence of NAC (20 mM) or Mito-TEMPO (MT, 200 μM) for 6 h. (g,h) Immunoblots of BMDMs primed with LPS (3 h), followed by 25-HC (80 μM) in the presence of 22-HC (50 or 100 μM) for 6 h (g), or primed with LPS in the presence of 22-HC (100 μM) or glibenclamide (50 μM) for 3 h, followed by ATP (2 mM, 45 min) (h). (i) Immunoblots of BMDMs primed with LPS (3 h), followed by 25-HC (80 μM) in the presence of 22-HC (100 μM) or glibenclamide (50 μM) for 6 h. (a,b,ei) Culture supernatants (Sup), cellular lysates (Lys) or DSS-crosslinked pellets (Pel + DSS) as indicated were analysed by immunoblot.
Figure 6
Figure 6. 25-HC promotes the microglial recruitment and oligodendrocyte cell death in an NLRP3 inflammasome-dependent manner.
(a) Immunohistochemical staining of coronal brain sections with anti-Iba-1 antibody (green) and DAPI (blue) after bilateral stereotaxic injection of 25-HC (100 μM) or vehicle into the brain of Nlrp3+/+ or Nlrp3−/− mice. Scale bar, 200 μm. (b) Quantification of Iba-1+ microglia in confocal images of vehicle- or 25-HC-injected brains from Nlrp3+/+ (WT) or Nlrp3−/− (KO) mice. (n=6). (c) Quantification of IL-1β in the brain homogenates of vehicle- or 25-HC-injected hemispheres from Nlrp3+/+ (WT) or Nlrp3−/− (KO) mice. (n=7) (d) Immunohistochemical staining of brain sections with anti-Iba-1 antibody (green) after stereotaxic injection of 25-HC (100 μM) together with recombinant IL-1 receptor antagonist (IL-1Ra, 5 μg). Scale bar, 50 μm. (e) Quantification of Iba-1+ microglia in the confocal images of vehicle- or 25-HC-injected brain sections as treated in d. (n=4) (f) Immunohistochemical staining of brain sections with anti-active caspase-3 antibody (green), anti-myelin basic protein antibody (MBP, red), and DAPI (blue). Lower panel is representative magnified image of a 25-HC-injected region. Arrows indicate the active caspase-3-positive oligodendrocytes (yellow). Scale bars, 200 μm (upper); 50 μm (lower). (g) Immunohistochemical staining of brain sections of Nlrp3+/+ or Nlrp3−/− mice stained as in f after stereotaxic injection of vehicle or 25-HC. Scale bar, 100 μm. (h) Quantification of active caspase-3+ oligodendrocytes in the confocal images of vehicle- or 25-HC-injected brain sections as treated in g. (n=6) (i) Quantification of active caspase-3+ oligodendrocytes in the confocal images of vehicle- or 25-HC-injected brain sections of Abcd1+/+ (WT) or Abcd1−/− mice. (n=6) For all panels, *P<0.05, **P<0.01 and ***P<0.001.

References

    1. Mosser J. et al. Putative X-linked adrenoleukodystrophy gene shares unexpected homology with ABC transporters. Nature 361, 726–730 (1993). - PubMed
    1. Singh I., Moser A. E., Goldfischer S. & Moser H. W. Lignoceric acid is oxidized in the peroxisome: implications for the Zellweger cerebro-hepato-renal syndrome and adrenoleukodystrophy. Proc. Natl Acad. Sci. USA 81, 4203–4207 (1984). - PMC - PubMed
    1. Powers J. M., Liu Y., Moser A. B. & Moser H. W. The inflammatory myelinopathy of adreno-leukodystrophy: cells, effector molecules, and pathogenetic implications. J. Neuropathol. Exp. Neurol. 51, 630–643 (1992). - PubMed
    1. van de Beek M. C. et al. C26:0-carnitine is a new biomarker for X-linked adrenoleukodystrophy in mice and man. PLoS ONE 11, e0154597 (2016). - PMC - PubMed
    1. Moser H. W. et al. Adrenoleukodystrophy: increased plasma content of saturated very long chain fatty acids. Neurology 31, 1241–1249 (1981). - PubMed

Publication types

MeSH terms