. 2016 Oct 25:6:35956.
doi: 10.1038/srep35956.

ADAMTS-10 and -6 differentially regulate cell-cell junctions and focal adhesions

Affiliations

ADAMTS-10 and -6 differentially regulate cell-cell junctions and focal adhesions

Stuart A Cain et al. Sci Rep. .

Abstract

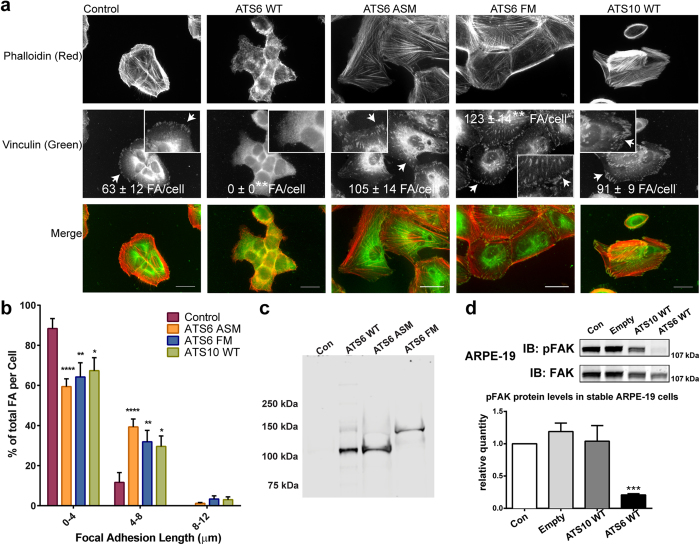
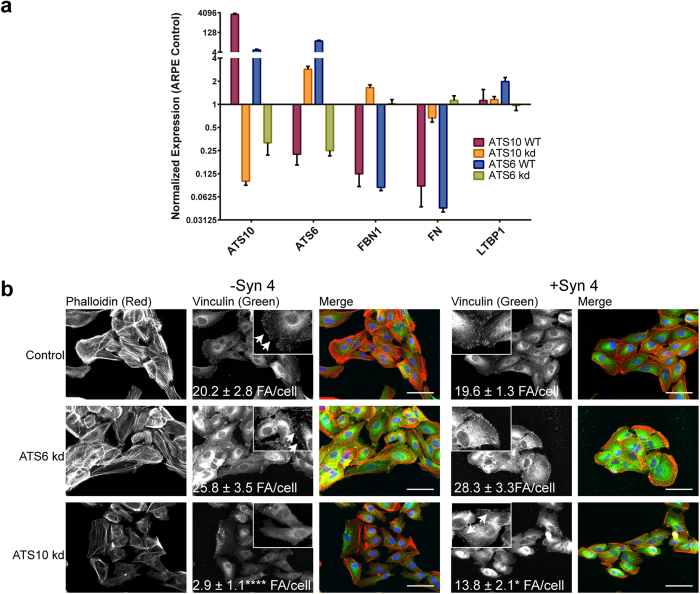
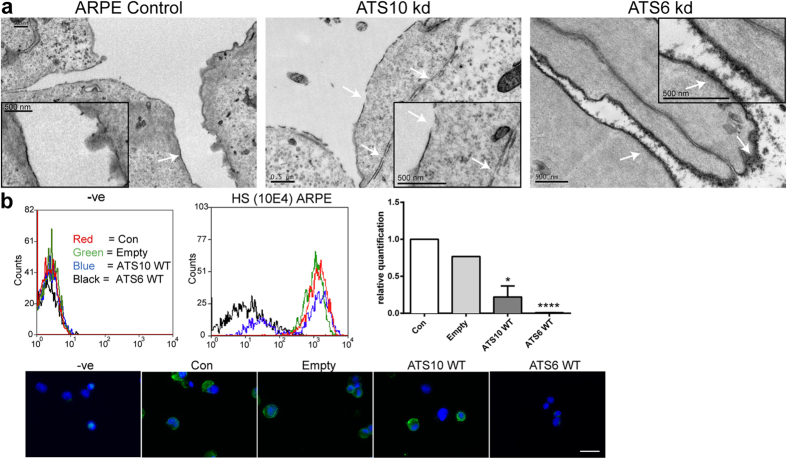
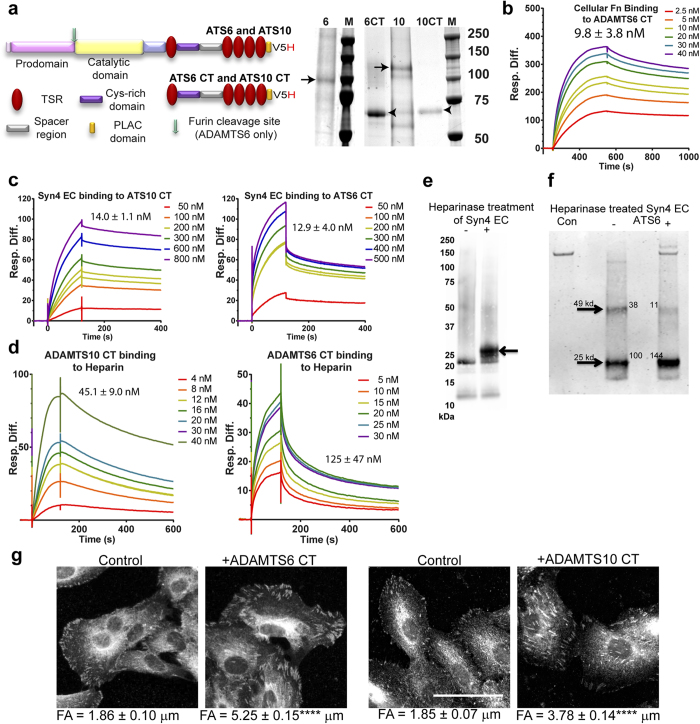
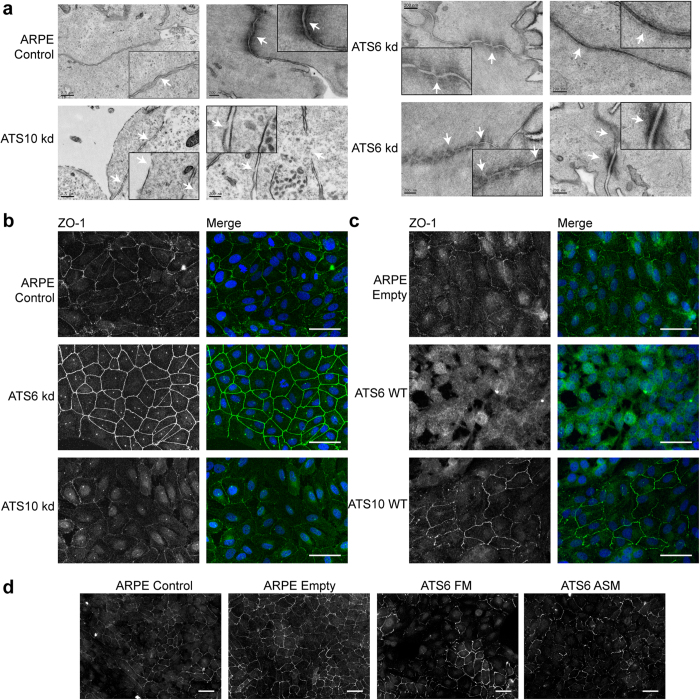
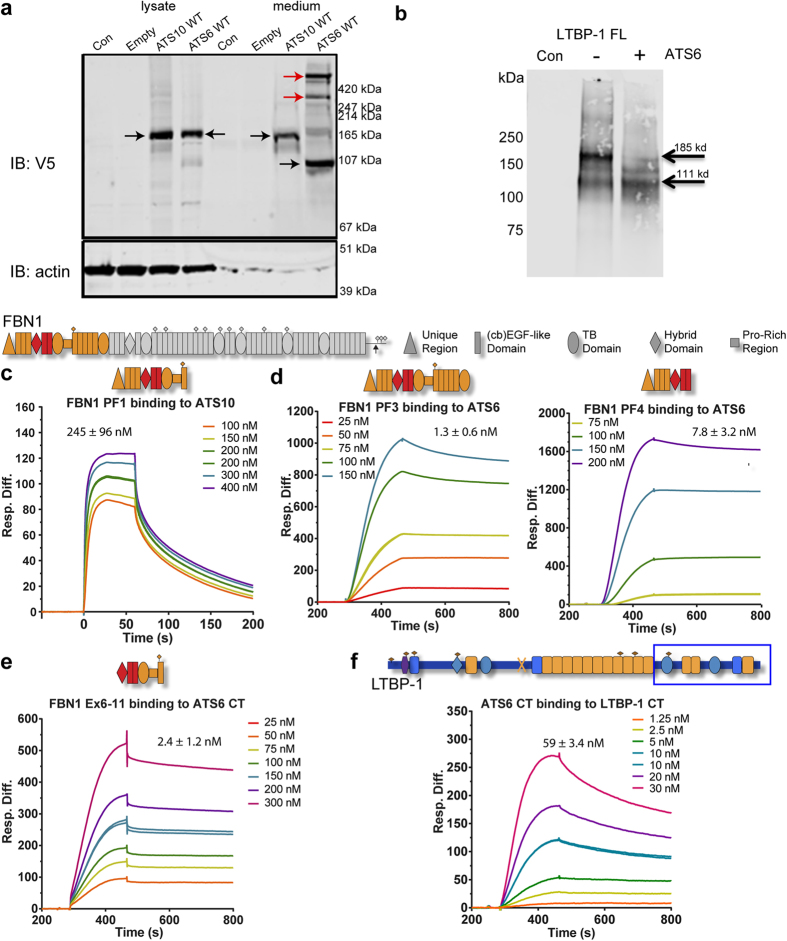
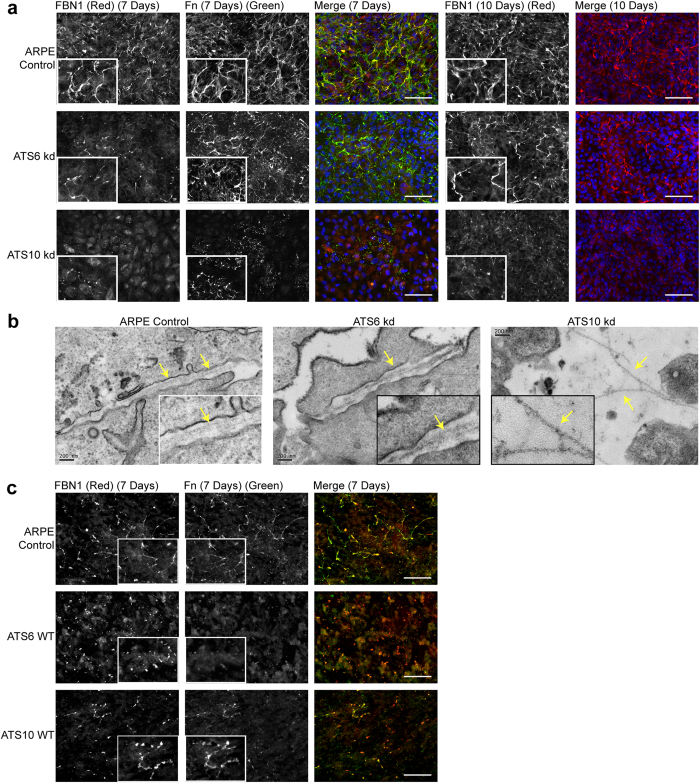
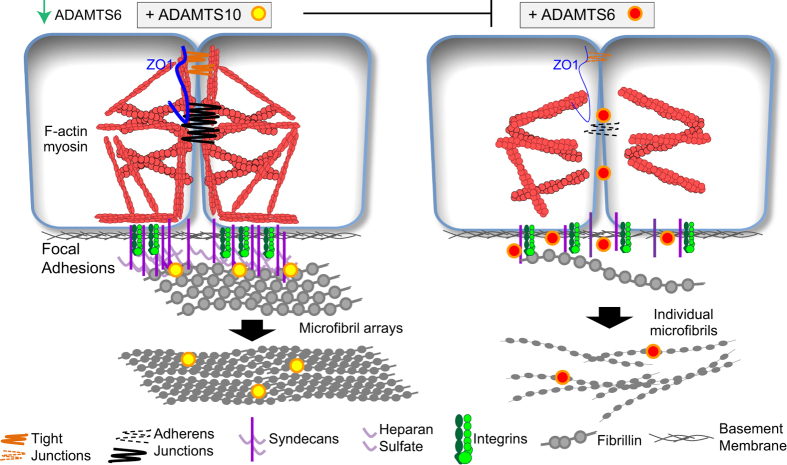
ADAMTS10 and ADAMTS6 are homologous metalloproteinases with ill-defined roles. ADAMTS10 mutations cause Weill-Marchesani syndrome (WMS), implicating it in fibrillin microfibril biology since some fibrillin-1 mutations also cause WMS. However little is known about ADAMTS6 function. ADAMTS10 is resistant to furin cleavage, however we show that ADAMTS6 is effectively processed and active. Using siRNA, over-expression and mutagenesis, it was found ADAMTS6 inhibits and ADAMTS10 is required for focal adhesions, epithelial cell-cell junction formation, and microfibril deposition. Either knockdown of ADAMTS6, or disruption of its furin processing or catalytic sites restores focal adhesions, implicating its enzyme activity acts on targets in the focal adhesion complex. In ADAMTS10-depleted cultures, expression of syndecan-4 rescues focal adhesions and cell-cell junctions. Recombinant C-termini of ADAMTS10 and ADAMTS6, both of which induce focal adhesions, bind heparin and syndecan-4. However, cells overexpressing full-length ADAMTS6 lack heparan sulphate and focal adhesions, whilst depletion of ADAMTS6 induces a prominent glycocalyx. Thus ADAMTS10 and ADAMTS6 oppositely affect heparan sulphate-rich interfaces including focal adhesions. We previously showed that microfibril deposition requires fibronectin-induced focal adhesions, and cell-cell junctions in epithelial cultures. Here we reveal that ADAMTS6 causes a reduction in heparan sulphate-rich interfaces, and its expression is regulated by ADAMTS10.


Figures

Figure 1
Figure 1. Overexpression of active ADAMTS6 inhibits focal adhesions, but not ADAMTS10.
(a) Immunofluorescence microscopy of ARPE-19A cells overexpressing ADAMTS6 or ADAMTS10. Focal adhesions were visualised by immuno-staining of vinculin (B/W, green) and phalloidin (B/W, red) on glass coverslips after 3 days. Shown are cells overexpressing ADAMTS6 wild type (ATS6 WT), an ADAMTS6 active site mutant (ATS6 ASM), an ADAMTS6 furin cleavage site mutant (ATS6 FM) and cells overexpressing ADAMTS10 wild type (ATS10 WT). Control cells were infected with lentivirus containing an empty vector. ATS6 WT cells had no detectable focal adhesions; however more focal adhesions per cell were detected with ATS6 ASM, ATS6 FM and ATS10 WT. Examples of focal adhesions are indicated by arrows. The number of focal adhesions (FA) per cell and length was calculated by manual annotation using ImageJ (FA number indicated (n = 5 cells)). Images were taken with a 40x objective. Scale bars indicate 50 μm. (b) FA lengths were categorised into 3 groups (0–4, 4–8 and 8–12 μm). The graph shows % of the total FA per cell of the 3 length groups. Cells overexpressing ATS6 ASM, ATS6 FM and ATS10 WT had significant increases in longer FA (4–8 μm). (focal adhesion measurements per cell n > 20). (c) Western blot of media taken from ARPE-19A cells overexpressing ADAMTS6 variants. ATS FM cannot be cleaved by furin so still contains the pro-domain. (d) ARPE-19A cells overexpressing ADAMTS6 (ATS6 WT) had greatly reduced pFAK in ARPE-19A. Western blotting analysis for total FAK and pFAK is shown. Quantification of band intensity is shown as a ratio of the control band intensity (n = 3). The western blot shown is from a representative experiment. Statistical significance for deviation from the control values was calculated using 1-way ANOVA (2-way ANOVA for FA length comparisons) with a Bonferroni’s multiple comparisons test using GraphPad Prism V6. Asterisk indicate P values where *P ≤ 0.05; **P ≤ 0.01; ***P ≤ 0.001; ****P ≤ 0.0001.
Figure 2
Figure 2. ADAMTS6 and ADAMTS10 can regulate the gene expression of each other.
(a) RT-qPCR analysis of gene expression for ADAMTS10 and ADAMTS6 overexpression (ATS10 WT and ATS6 WT) and knock-down (kd) in ARPE-19A cells. Relative expression normalized to control cells is shown, and was calculated using Bio-Rad CFX Manager V3.1. Normalized expression is plotted on a Log2 scale (n = 3 for both biological and technical replicates). (b) Immunofluorescence microscopy of ARPE-19A cells with siRNA treatment of ADAMTS10 (ATS10 kd) or ADAMTS6 (ATS6 kd). ATS6 kd cells had more focal adhesions than control cells; ATS10 kd cells had significantly fewer focal adhesions than control cells. Transfection with full-length syndecan-4 (+Syn 4) induced focal adhesions in ATS10 kd cells. Statistical significance for deviation from the control values was calculated using 1-way ANOVA with a Bonferroni’s multiple comparisons test using GraphPad Prism V6. Asterisk indicate P values where ****P ≤ 0.0001 (n > 8).
Figure 3
Figure 3. ADAMTS6 and ADAMTS10 can control HS at the cell surface.
(a) Electron microscopy image of ARPE-19A cells (control and ATS knockdowns) cultured for 2 days; cell surfaces are indicated with white arrows. The scale bars indicate 500 nm. ARPE-19A control and ADAMTS10 siRNA (kd) cells had smooth surfaces, but the ADAMTS6 kd cells had an abundant coating that resembled a thick glycocalyx. (b) Flow cytometry showing histograms of cells treated with anti-HS antibody (10E4), and secondary only control (−ve). Flow cytometry showed that ADAMTS6 overexpressing cells (ATS6 WT) cells were depleted of HS. Most ADAMTS10 overexpressing cells (ATS10 WT) retained HS, although some loss was apparent, which has resulted in a histogram with two peaks. These data are also quantitated; asterisks indicate P values where *P ≤ 0.05; ****P ≤ 0.0001. Cells were analysed using BD LSR Fortessa Analyzer. The flow-isolated cells (using Cytospin) are also shown, with HS (mAb 10E4) immunostaining (green) and nuclei were visualized with DAPI (blue). Images were taken with a 40x objective. Scale bar indicates 50 μm.
Figure 4
Figure 4. ADAMTS10 and ADAMTS6 interactions with syndecan-4 and modification of focal adhesions.
(a) Coomassie-stained SDS-PAGE showing purified recombinant full-length ADAMTS6 and ADAMTS10, expressed using the 293-EBNA system. ADAMTS6 was ~100 kDa and ADAMTS10 was ~140 kDa (arrows). The C-terminal regions of ADAMTS6 (6CT) and ADAMTS10 (10CT) were also expressed (arrowheads). Equal amounts of protein were loaded on the gel, however expression levels of the full-length proteins were lower than the C-terminal fragments. Domain structures of full-length molecules and the ADAMTS6 and ADAMTS10 C-terminal region are shown. For purification and detection purposes, all proteins had a C-terminal V5 and His6 tag added (V5H). (bd) Binding was analysed using Surface Plasmon Resonance, and the response difference (Resp. Diff.) for each experiment was plotted against time (s) (b) Biacore sensorgram showing that cellular FN (Sigma #F2518; isolated from human foreskin fibroblasts) binds to the C-terminal region of ADAMTS6. Resp. Diff. is the ADAMTS6-immobilized flow cell minus the control flow cell. The binding constant (KD) indicated and was calculated using 1:1 Langmuir model. (c) Biacore sensorgrams showing that ADAMTS10 CT and ADAMTS6 CT bind the ecto-domain of syndecan 4. Resp. Diff. is the syndecan-immobilized flow cell minus the control flow cell. The KD for each interaction is shown. (d) Biacore sensorgrams showing that ADAMTS10 CT and ADAMTS6 CT bind heparin. Resp. Diff. is the heparin-immobilized flow cell minus the control flow cell. The KD for each interaction is shown. (e) Recombinant syndecan-4 ectodomain was treated with heparinases I, II and III (indicated +) and analysed by SDS-PAGE and western blotting using anti-syndecan-4 antibody. (f) Heparinase-treated syndecan-4 ectodomain incubated with full-length recombinant ADAMTS6 (ATS6) overnight at 37 °C. (g) Control ARPE-19A cells ± supplementation with purified recombinant C-terminal regions of ADAMTS6, and ADAMTS10 (10 nM) showing focal adhesions (FA) (vinculin stained, B/W). Focal adhesions (FA) lengths were calculated by manually using ImageJ. Adhesions were significantly longer and more prominent in the presence of the C-terminal ADAMTS6 and ADAMTS10 fragment. Statistical significance for deviation from the control values was calculated using 1-way ANOVA with a Bonferroni’s multiple comparisons test using GraphPad Prism V6. Asterisk indicate P values where ****P ≤0.0001. Scale bar indicates 50 μm.
Figure 5
Figure 5. Epithelial cell-cell junctions, and effects of ADAMTS siRNA.
(a) Electron micrography of ARPE-19A cells cultured for 2 days; cell junctions are indicated with white arrows. The scale bars indicate 0.5 μm (1st column) or 200 nm. Control ARPE-19A cells had few tight junctions but some adherens junctions. ADAMTS10 siRNA cultures had disrupted membranes and no tight junctions. ADAMTS6 siRNA cultures had numerous tight, adherens and desmosome junctions. (bd) Immunofluorescence microscopy of ARPE-19A cultured on glass coverslips for 4 days. (b) Cells were treated with siRNAs to down-regulate ADAMTS6 (ATS6 kd) or ADAMTS10 (ATS10 kd). (c) Cells with lentivector overexpression of ADAMTS10 (ATS10 WT) or ADAMTS6 (ATS6 WT). After fixation, cells were stained for ZO-1 (B/W, green), and nuclei were visualized with DAPI (blue). Images were taken with a 40x objective. Scale bar indicates 50 μm. (d) Cells with lentivector overexpression of ADAMTS6 mutants (ATS6 FM and ATS6 ASM). After fixation, cells were stained for ZO-1. Images were taken with a 20x objective. Scale bar indicates 50 μm.
Figure 6
Figure 6. ADAMTS6 but not ADAMTS10 is processed and catalytically active, binds microfibrillar proteins.
(a) Western blot against V5 tag of ADAMTS10 (ATS10 WT) and ADAMTS6 (ATS6 WT) overexpressed proteins using lentivirus. The SDS-PAGE was run under reducing conditions. Both full-length molecules expressed well in this system. Unprocessed ADAMTS10 was present in medium and cell lysates, whereas ADAMTS6 was processed in medium (black arrows). Some larger bands may be aggregated forms of the processed molecule (red arrow), which are possibly trimeric and tetrameric in nature. (b) Full-length LTBP-1 was treated with full-length recombinant ADAMTS6 overnight at 37 °C (molar ratio LTBP-1:ADAMTS6 3:1). Western blot analysis using anti-LTBP-1 C-terminal antibody showed a reduction in full-length LTBP-1 with a relative molecular mass of 185 kDa, and an increase in intensity of a 111 kDa degradation product. The cleavage site of BMP-1, indicated by ‘X’ on LTBP-1 domain map (Fig. 6F), also generates a 110 kDa C-terminal fragment. Control lane (con) contains ADAMTS6 only. (cf) Biacore sensorgrams showing that: (c) Full-length ADAMTS10 binds the fibrillin-1 PF1 fragment, and (d) full-length ADAMTS6 binds to recombinant N-terminal fibrillin-1 (PF3 and PF4). (e) To further resolve the binding regions, it was found that ADAMTS6 CT regions (Fig. 4) bound fibrillin-1 Ex6–11 fragment. The binding of C-terminal ADAMTS6 was mapped to exons 6–8 of FBN1, indicated in red. (f) C-terminal ADAMTS6 binds to LTBP-1 C-terminal region (indicated by box). Binding was analysed using Surface Plasmon Resonance, and the response difference (Resp. Diff.) for each experiment was plotted against time (s). Resp. Diff. is the ligand-immobilized flow cell minus the control flow cell.
Figure 7
Figure 7. Effects of ADAMTS knockdown on fibrillin and fibronectin deposition.
(a) Immunofluorescence microscopy of ARPE-19A cells cultured on glass coverslips for 7 and 10 days. Cells were treated with siRNAs to down-regulate either ADAMTS6 (ATS6 kd) or ADAMTS10 (ATS10 kd). After fixation, cells were stained for fibrillin-1 (FBN1; B/W, red) and FN (B/W, green), and nuclei were visualized with DAPI (blue). Shown are images taken with a 40x objective, plus a 2x zoomed area of the fibrillin-1 and FN stained images (inset). Scale bars indicate 50 μm. (b) Electron micrography of ARPE-19A cells cultured for 2 days; fibrillin microfibrils are indicated with yellow arrows. The scale bars indicate 200 nm. Control ARPE-19A and ADAMTS6 siRNA cultures contained microfibril arrays, but in ADAMTS10 siRNA cultures only single microfibrils were seen. (c) Immunofluorescence microscopy of ARPE-19A cells cultured on glass coverslips for 7 days. Cells with lentivector overexpression of ADAMTS10 (ATS10 WT) or ADAMTS6 (ATS6 WT) were stained for fibrillin-1 (B/W, red) and FN (B/W, green). Shown are images taken with a 40x objective, plus a 4x zoomed area of the FBN1 and FN stained images (inset). Scale bars indicate 50 μm.
Figure 8
Figure 8. Model of how ADAMTS6 and ADAMTS10 can regulate cell and focal adhesions and alter deposition of fibrillin microfibril arrays by retinal epithelial cells.
In the presence of ADAMTS10, which down regulates ADAMTS6 gene expression, cells can form adherens and tight junctions, and focal adhesions, which together support the formation of ordered microfibril arrays by enhancing fibrillin-1 multimerization and the organisation of microfibrils within bundles. When ADAMTS10 is depleted, and ADAMTS6 is consequently enhanced, cell-cell junctions are lost and cell surface HS is reduced. Consequently, fibrillin-1 multimerization and microfibril formation are reduced, and bundles are disorganized. The cytoskeleton also becomes poorly arranged.

References

    1. Dagoneau N. et al.. ADAMTS10 mutations in autosomal recessive Weill-Marchesani syndrome. Am. J. Hum. Genet. 75, 801–806 (2004). - PMC - PubMed
    1. Le Goff C. & Cormier-Daire V. From tall to short: the role of TGFbeta signaling in growth and its disorders. Am. J. Med. Genet. C Semin. Med. Genet. 160C, 145–153 (2012). - PubMed
    1. Kutz W. E. et al.. ADAMTS10 protein interacts with fibrillin-1 and promotes its deposition in extracellular matrix of cultured fibroblasts. J. Biol. Chem. 286, 17156–17167 (2011). - PMC - PubMed
    1. Somerville R. P., Jungers K. A. & Apte S. S. Discovery and characterization of a novel, widely expressed metalloprotease, ADAMTS10, and its proteolytic activation. J. Biol. Chem. 279, 51208–51217 (2004). - PubMed
    1. Baldwin A. K., Simpson A., Steer R., Cain S. A. & Kielty C. M. Elastic fibres in health and disease. Expert Rev. Mol. Med. 15, e8 (2013). - PubMed

Publication types