Differential expression of filamin B splice variants in giant cell tumor cells
- PMID: 27779699
- PMCID: PMC5112600
- DOI: 10.3892/or.2016.5197
Differential expression of filamin B splice variants in giant cell tumor cells
Abstract
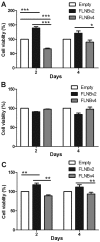
Giant cell tumor of bone (GCT) is the most commonly reported non-malignant bone tumor in Hong Kong. This kind of tumor usually affects people aged 20-40 years. Also, it is well known for recurrence locally, especially when the tumor cannot be removed completely. Filamins are actin-binding proteins which contain three family members, filamin A, B and C. They are the products of three different genes, FLNA, FLNB and FLNC, which can generate various transcript variants in different cell types. In this study, we focused on the effects of FLNBv2 and FLNBv4 toward GCT cells. The only difference between FLNBv2 and FLNBv4 is that FLNBv4 does not contain hinge 1 region. We found that the relative abundance of FLNBv4 varies among different GCT cell lines while the expression level of FLNBv4 in normal osteoblasts was only marginally detectable. In the functional aspect, overexpression of FLNBv4 led to upregulation of RANKL, OCN, OPG and RUNX2, which are closely related to GCT cell survival and differentiation. Moreover, FLNBv4 can have a negative effect on cell viability of GCT cells when compare with FLNBv2. In conclusion, splicing variants of FLNB are differentially expressed in GCT cells and may play a role in the proliferation and differentiation of tumor cells.
Figures


Similar articles
-
The role of TWIST as a regulator in giant cell tumor of bone.J Cell Biochem. 2011 Sep;112(9):2287-95. doi: 10.1002/jcb.23149. J Cell Biochem. 2011. PMID: 21503964
-
Identification of differentially expressed genes and their subpathways in recurrent versus primary bone giant cell tumors.Int J Oncol. 2014 Sep;45(3):1133-42. doi: 10.3892/ijo.2014.2501. Epub 2014 Jun 18. Int J Oncol. 2014. PMID: 24969034
-
Expression of bone morphogenetic proteins in giant cell tumor of bone.Anticancer Res. 2009 Jun;29(6):2219-25. Anticancer Res. 2009. PMID: 19528484
-
Giant cell tumour of bone: morphological, biological and histogenetical aspects.Int Orthop. 2006 Dec;30(6):484-9. doi: 10.1007/s00264-006-0215-7. Epub 2006 Sep 30. Int Orthop. 2006. PMID: 17013643 Free PMC article. Review.
-
[Histogenesis of giant cell tumors].Pathologe. 2002 Sep;23(5):332-9. doi: 10.1007/s00292-002-0552-2. Epub 2002 Aug 28. Pathologe. 2002. PMID: 12376858 Review. German.
Cited by
-
Filamin B extensively regulates transcription and alternative splicing, and is associated with apoptosis in HeLa cells.Oncol Rep. 2020 May;43(5):1536-1546. doi: 10.3892/or.2020.7532. Epub 2020 Mar 4. Oncol Rep. 2020. PMID: 32323860 Free PMC article.
-
Splicing dysregulation in glioblastoma alters the function of cell migration-related genes.Glia. 2025 Feb;73(2):251-270. doi: 10.1002/glia.24630. Epub 2024 Oct 24. Glia. 2025. PMID: 39448549
References
-
- Zheng MH, Robbins P, Xu J, Huang L, Wood D, Papadimitriou J. The histogenesis of giant cell tumour of bone: a model of interaction between neoplastic cells and osteoclasts. Histol Histopathol. 2001;16:297–307. - PubMed
MeSH terms
Substances
LinkOut - more resources
Full Text Sources
Other Literature Sources
Medical
Miscellaneous

