. 2017 Apr 1;595(7):2301-2317.
doi: 10.1113/JP273191. Epub 2016 Dec 28.

Differential roles of two delayed rectifier potassium currents in regulation of ventricular action potential duration and arrhythmia susceptibility

Affiliations

Differential roles of two delayed rectifier potassium currents in regulation of ventricular action potential duration and arrhythmia susceptibility

Ryan A Devenyi et al. J Physiol. .

Abstract

Key points: Arrhythmias result from disruptions to cardiac electrical activity, although the factors that control cellular action potentials are incompletely understood. We combined mathematical modelling with experiments in heart cells from guinea pigs to determine how cellular electrical activity is regulated. A mismatch between modelling predictions and the experimental results allowed us to construct an improved, more predictive mathematical model. The balance between two particular potassium currents dictates how heart cells respond to perturbations and their susceptibility to arrhythmias.

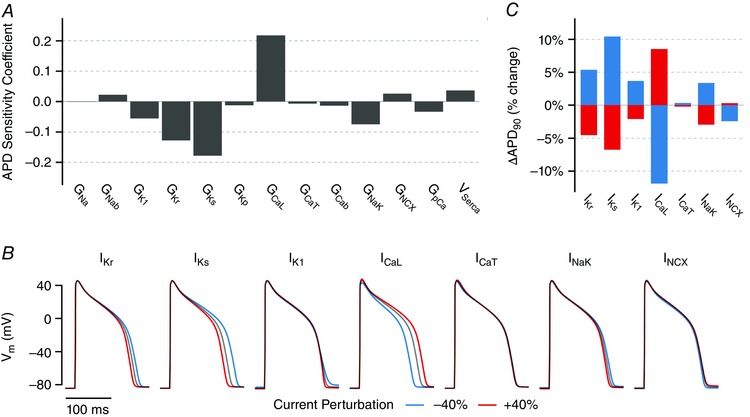
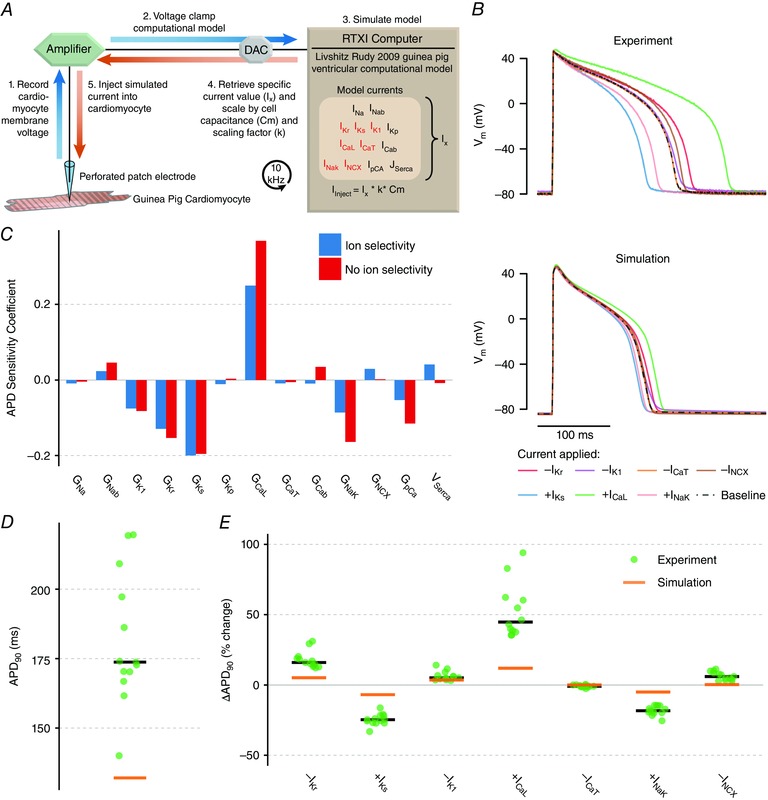
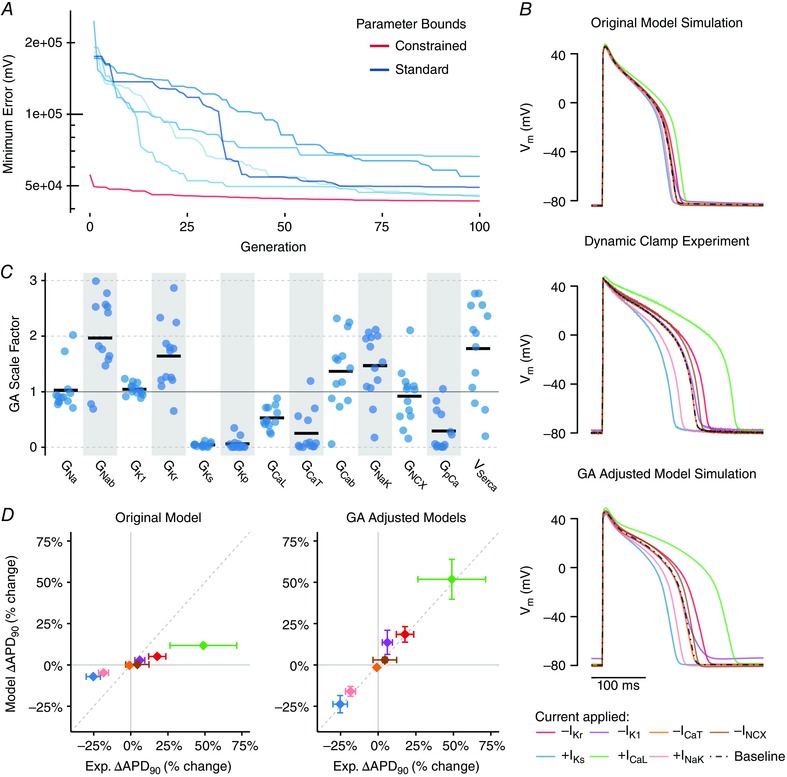
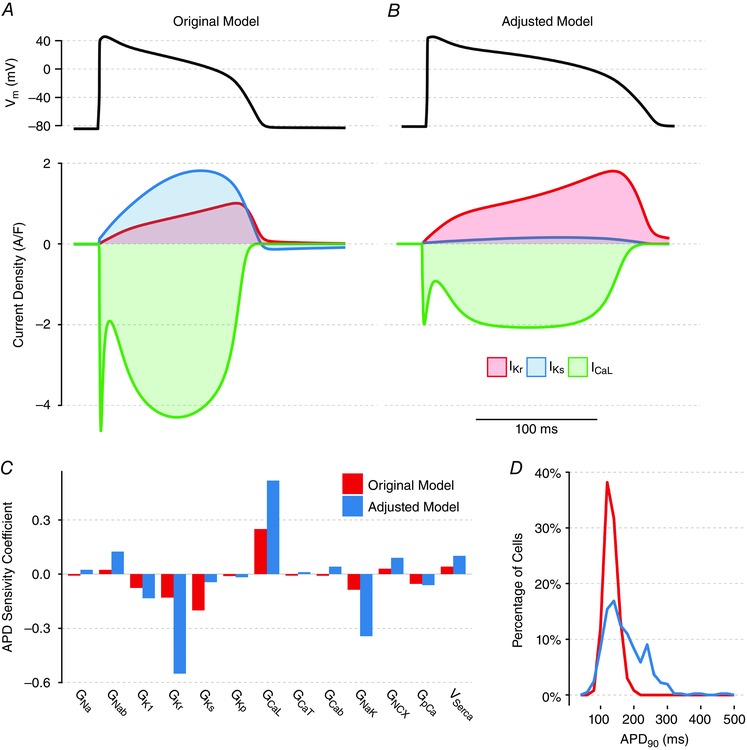
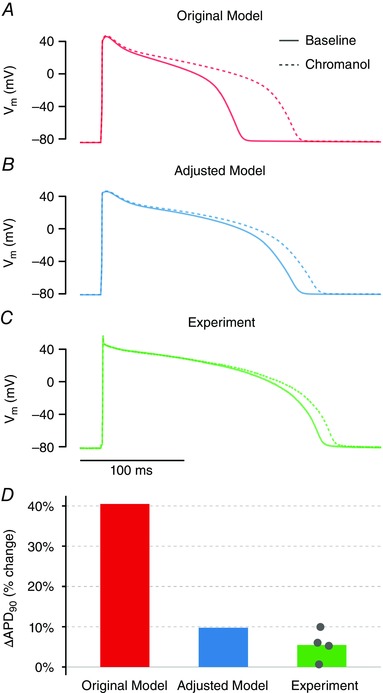
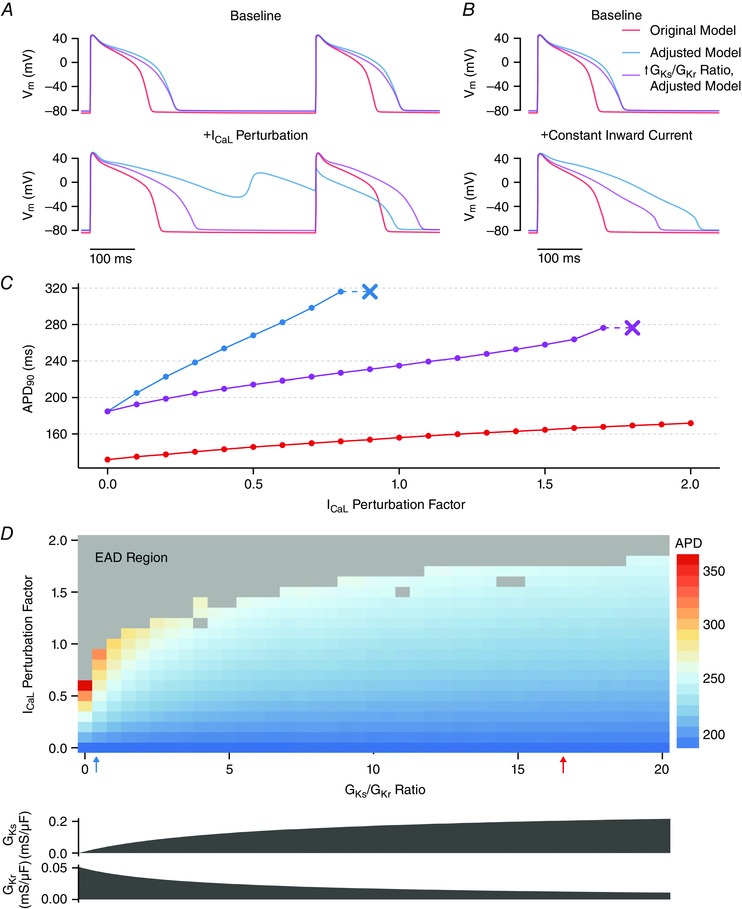
Abstract: Imbalances of ionic currents can destabilize the cardiac action potential and potentially trigger lethal cardiac arrhythmias. In the present study, we combined mathematical modelling with information-rich dynamic clamp experiments to determine the regulation of action potential morphology in guinea pig ventricular myocytes. Parameter sensitivity analysis was used to predict how changes in ionic currents alter action potential duration, and these were tested experimentally using dynamic clamp, a technique that allows for multiple perturbations to be tested in each cell. Surprisingly, we found that a leading mathematical model, developed with traditional approaches, systematically underestimated experimental responses to dynamic clamp perturbations. We then re-parameterized the model using a genetic algorithm, which allowed us to estimate ionic current levels in each of the cells studied. This unbiased model adjustment consistently predicted an increase in the rapid delayed rectifier K+ current and a drastic decrease in the slow delayed rectifier K+ current, and this prediction was validated experimentally. Subsequent simulations with the adjusted model generated the clinically relevant prediction that the slow delayed rectifier is better able to stabilize the action potential and suppress pro-arrhythmic events than the rapid delayed rectifier. In summary, iterative coupling of simulations and experiments enabled novel insight into how the balance between cardiac K+ currents influences ventricular arrhythmia susceptibility.

Keywords: ion channels; mathematical model; patch clamp.


Figures

Figure 1
Figure 1. Effects of acute changes in ionic currents on APD
A, population‐based parameter sensitivity coefficients for the sensitivity of APD to variation in 13 parameters, representing maximal ionic current densities, in the guinea pig cardiomyocyte model. Each bar quantifies how an acute change in that current influences APD. B, baseline APs at steady‐state 2 Hz pacing (black) superimposed with APs resulting from a 40% increase (red) and decrease (blue) in each current for 20 stimuli. C, quantification of change in APD for results shown in (B).
Figure 2
Figure 2. Dynamic clamp results testing the effect of seven ionic current perturbations on APD
A, dynamic clamp schematic. Using whole‐cell patch clamp, recorded voltage is used to calculate a current based on the model, and this current is scaled and injected into the cell in real‐time. B, dynamic clamp results in experiment (top) and simulation (bottom). Currents were calculated in the model based on recorded voltage and were scaled for 20 stimuli each as either +0.4·I (+I Ks, +I CaL, +I NaK) to simulate a 40% increase in that current or –0.4·I to simulate a 40% decrease (–I Kr, –I K1, –I CaT, –I NCX). Simulation accounted for limitations of the dynamic clamp method to enable direct comparison with experiment. C, parameter sensitivity analysis of acute parameter changes where changes include ionic selectivity (blue; as in Fig. 1 C) and where they do not (red). D, comparison of experimentally recorded baseline APD (green dots, black bar shows median) compared to simulation (orange bar). E, comparison of changes in APD with each perturbation in experiments and simulation. Experimental results from 12 cells from three animals.
Figure 3
Figure 3. Genetic algorithm (GA) improves model agreement with experiment
A, best individual model‐experiment discrepancy decreases over successive generations (typical cell). For each cell, five independent runs with standard parameter bounds (0.01 to 3) were performed (blue). The range of each of the 13 parameters across the five runs was used to create new constrained parameter bounds for an additional run (red), and the best individual at the end of this constrained run is taken as the best solution. B, comparison of simulation of the dynamic clamp protocol in original model (top), experimental recordings (middle) and simulation of the dynamic clamp protocol in the model with the GA‐adjusted parameters (bottom). Top and middle traces are the same as in Fig. 2 and are re‐plotted here to allow for comparison. C, scale factors resulting from GA process (n = 12 cells, black bar indicates mean). D, change in APD with each of the dynamic clamp perturbations (indicated by the same colours as the traces in B) in the GA‐adjusted models (right) show much better agreement with experimental results than the original model (left). Data are the mean ± SD for each effect (n = 12).
Figure 4
Figure 4. Behaviours in GA‐adjusted model compared to original model at 2 Hz
The parameters in the adjusted model are the mean parameters from 10 of the cell‐specific GA fits that passed quality control. The adjusted model (B) exhibits both longer APD (top) and very different current balance (bottom) compared to the original model (A). C, parameter sensitivity coefficients quantifying sensitivity of APD to acute changes in the levels of 13 currents in the original model and the adjusted model, under the same conditions as in Fig. 1 C. D, distribution of APD in the populations of models used to generate (C), demonstrating greater variability in APD in the adjusted model.
Figure 5
Figure 5. Experimental confirmation of greatly reduced I Ks predicted by model adjustments
A, in the original model, 80% reduction in G Ks dramatically prolongs APD. B, the adjusted model shows only a small (10%) prolongation in APD with 80% reduction in GKs. C, in experimental measurements (n = 4), 10 μm chromanol 293B (which should block I Ks by approximately 80%) caused minimal APD prolongation. D, quantification of percentage change in APD with 10 μm chromanol 293B for each condition shows better agreement between adjusted model and experiment.
Figure 6
Figure 6. I Ks/I Kr balance determines susceptibility to APD prolongation and early afterdepolarizations (EADs) in response to depolarizing perturbations
AC, results from the original model, the adjusted model, and a third model (the ‘altered ratio’ model) with APD identical to the adjusted model, but only G Ks/G Kr altered. A, increasing I CaL by a constant absolute magnitude (+84% relative to the original model) prolonged APD mildly in the original model (red), prolonged APD to a greater extent in the adjusted ratio model and resulted in EADs with 2:1 block in the adjusted model. B, applying a constant inward current of 0.9 A/F during the AP (when depolarized above –60 mV) prolonged the APD in all three models, but with a much larger effect in the adjusted model (blue). C, relationship between I CaL perturbation factor and APD and EAD threshold (indicated by the ‘x’) in the three models. D, relationship between the G Ks/G Kr ratio and I CaL perturbation factor on APD and EAD generation. In all models, only G Ks and G Kr are altered (as shown) to produce a model with the same baseline APD as the adjusted model but with a given G Ks/G Kr ratio. The G Ks/G Kr ratios for the original (red) and adjusted (blue) model are indicated by the arrows.

References

    1. Achard P & De Schutter E (2006). Complex parameter landscape for a complex neuron model. PLoS Comput Biol 2, e94. - PMC - PubMed
    1. Ahrens‐Nicklas RC & Christini DJ (2009). Anthropomorphizing the mouse cardiac action potential via a novel dynamic clamp method. Biophys J 97, 2684–2692. - PMC - PubMed
    1. Banyasz T, Horvath B, Jian Z, Izu LT & Chen‐Izu Y (2011). Sequential dissection of multiple ionic currents in single cardiac myocytes under action potential‐clamp. J Mol Cell Cardiol 50, 578–581. - PMC - PubMed
    1. Banyasz T, Horvath B, Virag L, Barandi L, Szentandrassy N, Harmati G, Magyar J, Marangoni S, Zaza A, Varro A & Nanasi PP (2009). Reverse rate dependency is an intrinsic property of canine cardiac preparations. Cardiovasc Res 84, 237–244. - PubMed
    1. Banyasz T, Jian Z, Horvath B, Khabbaz S, Izu LT & Chen‐Izu Y (2014). Beta‐adrenergic stimulation reverses the I Kr‐I Ks dominant pattern during cardiac action potential. Pflügers Arch 466, 2067–2076. - PMC - PubMed

Publication types

MeSH terms

Substances

LinkOut - more resources